

Container Evolution

容器编排
ansible/saltstack 传统应用编排工具dockerdocker compose docker单机编排docker swarm docker主机加入docker swarm资源池docker machine 完成docker主机加入docker swarm资源池的先决条件/预处理工具
mesos(idc os) + marathon 面向容器编排的框架kubernetes(borg)- 自动装箱(基于依赖 自动完成容器部署 不影响其可用性)
- 自我修复
- 水平扩展
- 服务发现和负载均衡
- 自动发布和回滚
- 密钥和配置管理
- 存储编排
- 任务批量处理运行
概述
概述
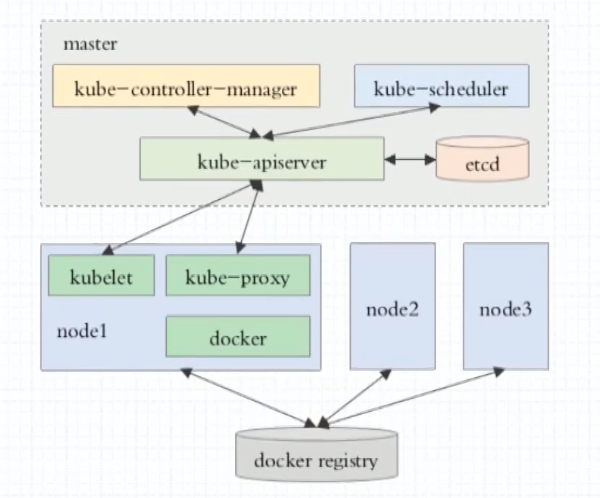
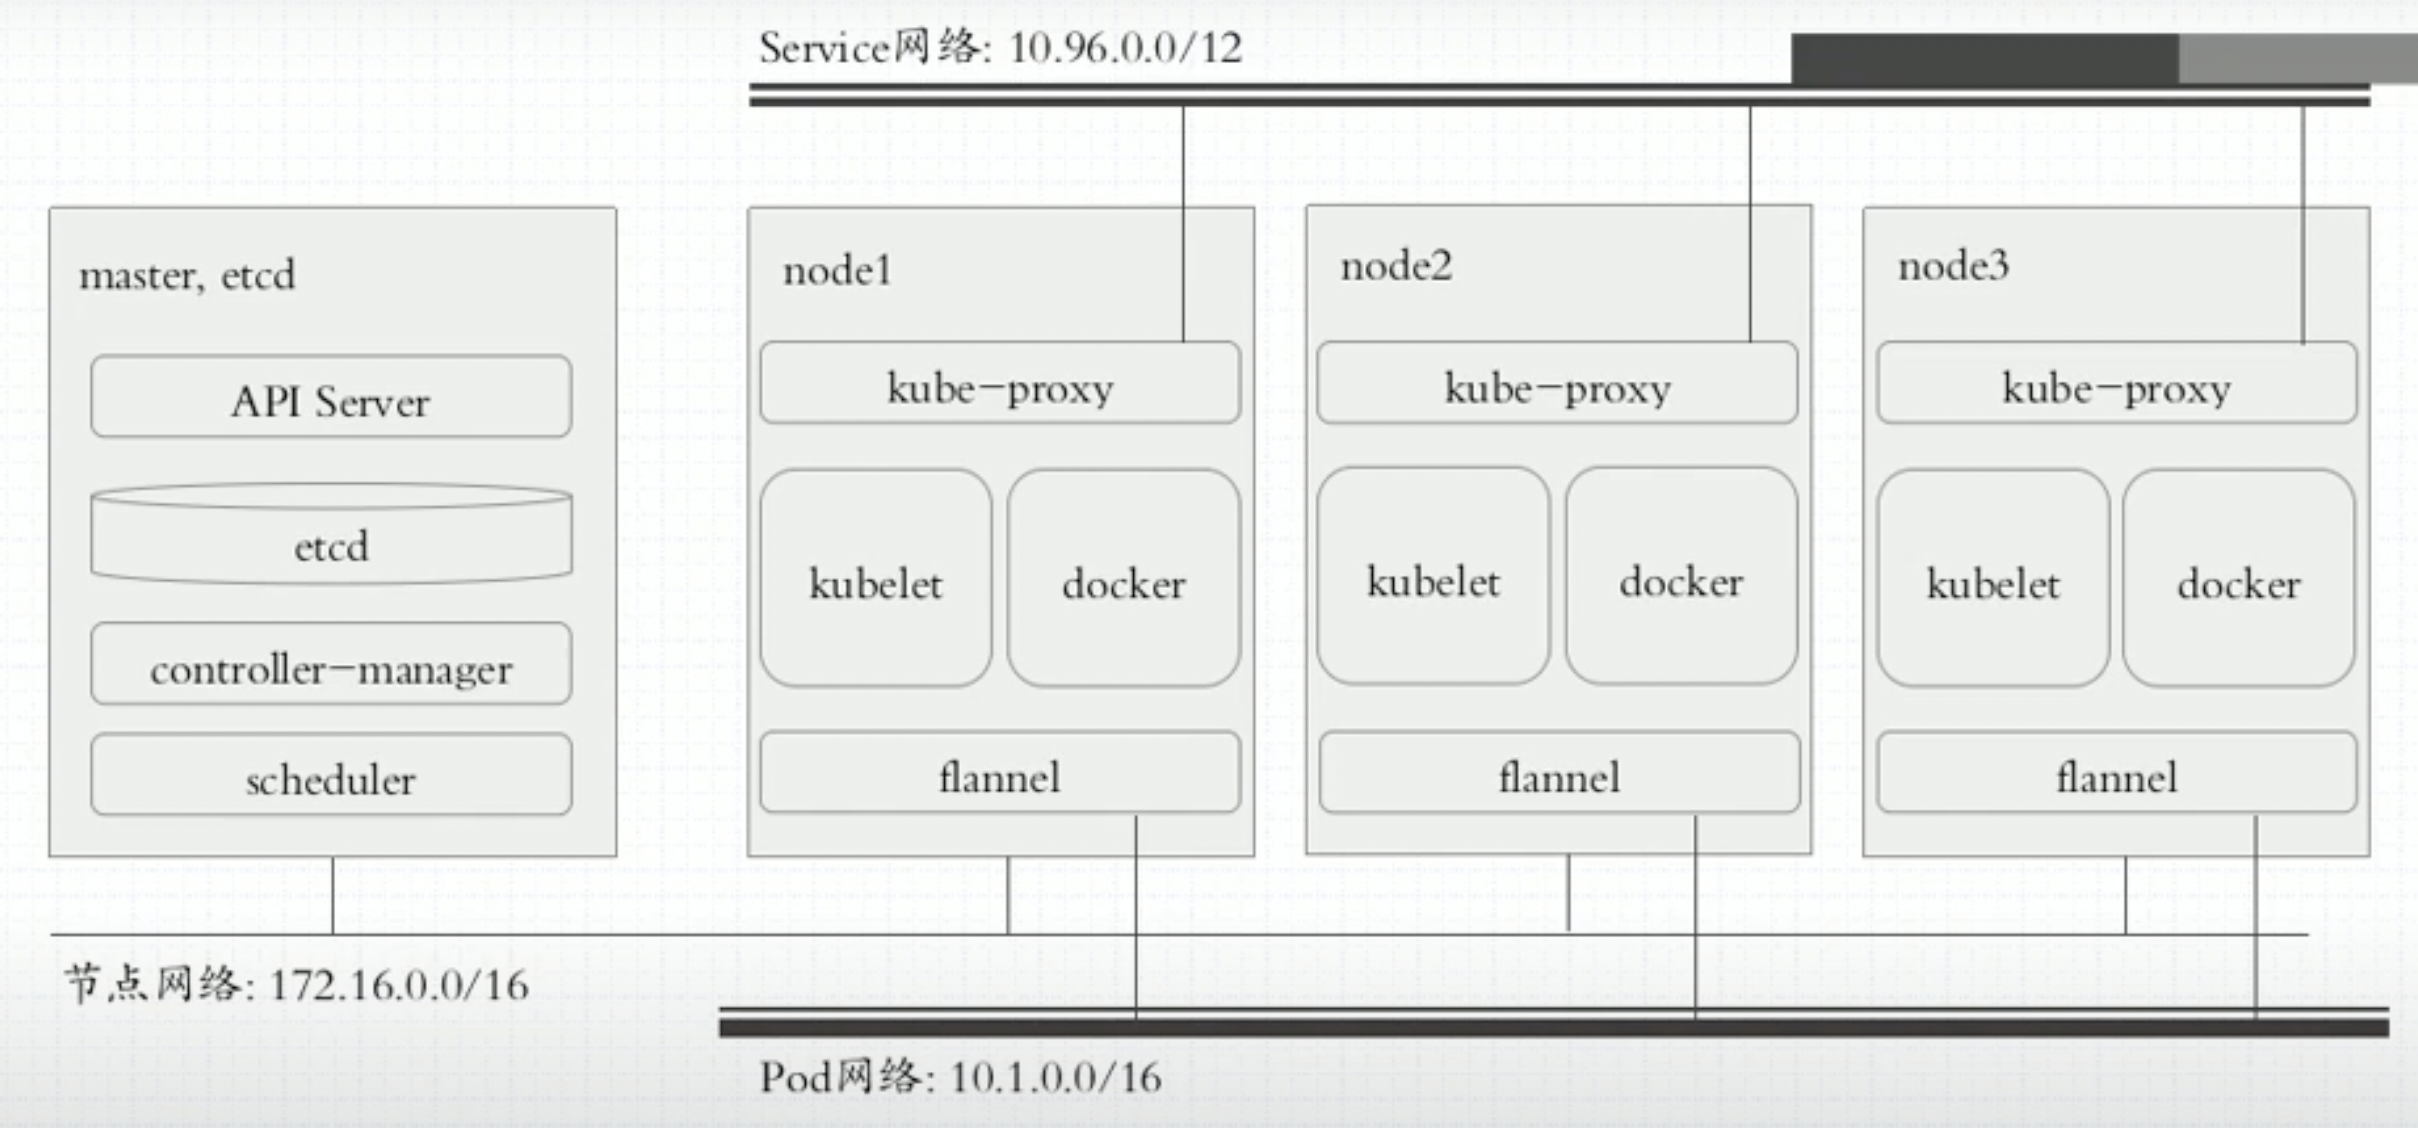
组件
Kubernetes组件
集群安装
二进制安装
参考kubeasz项目
kubeadm安装
使用kubeadm引导集群
主机环境预设
- OS: Ubuntu 22.04 LTS
- Kubernetes: v1.29.13
- Container Runtime(二选一即可)
测试环境说明
- 1master/2+node 也可以多master 根据自己环境安排
- 集群节点需要做时间同步
- 禁用swap
- swapoff -a
- systemctl –type swap
- systemctl mask SWAP_DEV
- 禁用默认配置的iptables
- 加载br_netfilter模块
- modprobe br_netfilter
- 写入/etc/modules(开机启动)
安装容器运行时
docker+cri-docekrd
 1
 2
 3
 4
 5
 6
 7
 8
 9
10
11
| apt -y install apt-transport-https ca-certificates curl software-properties-common
curl -fsSL http://mirrors.aliyun.com/docker-ce/linux/ubuntu/gpg | apt-key add -
add-apt-repository "deb [arch=amd64] http://mirrors.aliyun.com/docker-ce/linux/ubuntu $(lsb_release -cs) stable"
apt update
# 安装docker-ce
apt -y install docker-ce
# 进行完下面配置后 重启服务
systemctl restart docker
ststemctl enable docker
|
- docker配置
- kubelet需要让docker容器引擎使用systemd作为CGroup的驱动 其默认值为cgroupfs
- 我们还需要编辑docker的配置文件/etc/docker/daemon.json 参考下面配置
- 其中的registry-mirrors用于指明使用的镜像加速服务 参考国内无法下载Docker镜像的多种解决方案
- 提示: 自Kubernetes v1.22版本开始 未明确设置kubelet的cgroup driver时 则默认即会将其设置为systemd
 1
 2
 3
 4
 5
 6
 7
 8
 9
10
11
| {
"registry-mirrors": [
"https://dockerpull.cn"
],
"exec-opts": ["native.cgroupdriver=systemd"],
"log-driver": "json-file",
"log-opts": {
"max-size": "200m"
},
"storage-driver": "overlay2"
}
|
- 为docker设置代理(可选)
- Kubeadm部署Kubernetes集群的过程中 默认使用Google的Registry服务registry.k8s.io上的镜像
- 例如
registry.k8s.io/kube-apiserver等 但国内部分用户可能无法访问到该服务 - 我们也可以使用国内的镜像服务来解决这个问题 例如
registry.aliyuncs.com/google_containers - 若选择使用国内的镜像服务 则配置代理服务的步骤为可选
- 设置代理配置 编辑/lib/systemd/system/docker.service
 1
 2
 3
 4
 5
 6
 7
 8
 9
10
11
12
13
14
15
16
| # 重要提示:
# 节点网络(例如本示例中使用的192.168.0.0/16)
# Pod网络(例如本示例中使用的10.244.0.0/16)
# Service网络(例如本示例中使用的10.96.0.0/12)以及127网络等本地使用的网络
# 必须明确定义为不使用所配置的代理 否则将很有可能带来无法预知的本地网络通信故障
# 请将下面配置段中的 $PROXY_SERVER_IP 替换为你的代理服务器地址
# 将$PROXY_PORT 替换为你的代理服所监听的端口
# 另外还要注意所使用的协议http是否同代理服务器提供服务的协议相匹配 如有必要 请自行修改为https
Environment="HTTP_PROXY=http://$PROXY_SERVER_IP:$PROXY_PORT"
Environment="HTTPS_PROXY=http://$PROXY_SERVER_IP:$PROXY_PORT"
Environment="NO_PROXY=127.0.0.0/8,172.17.0.0/16,172.29.0.0/16,10.244.0.0/16,192.168.0.0/16,10.96.0.0/12,magedu.com,cluster.local"
# 修改完配置重启服务
systemctl daemon-reload
systemctl restart docker
|
containerd
- 安装容器运行时containerd
- Ubuntu 2204上安装Containerd有两种选择
- Ubuntu系统官方程序包仓库中的containerd
- Docker社区提供的
containerd.io(本文选择该种方式)
- 安装并启动containerd.io
1
2
3
4
5
6
| # 生成containerd.io相关程序包的仓库 这里以阿里云的镜像服务器为例
apt -y install apt-transport-https ca-certificates curl software-properties-common
curl -fsSL http://mirrors.aliyun.com/docker-ce/linux/ubuntu/gpg | apt-key add -
add-apt-repository "deb [arch=amd64] http://mirrors.aliyun.com/docker-ce/linux/ubuntu $(lsb_release -cs) stable"
apt update
apt-get -y install containerd.io
|
1
2
| mkdir /etc/containerd
containerd config default > /etc/containerd/config.toml
|
 1
 2
 3
 4
 5
 6
 7
 8
 9
10
11
12
13
14
15
16
17
18
19
20
21
22
23
24
25
26
27
28
29
30
31
| # 1. 修改containerd使用SystemdCgroup
[plugins."io.containerd.grpc.v1.cri".containerd.runtimes.runc]
[plugins."io.containerd.grpc.v1.cri".containerd.runtimes.runc.options]
SystemdCgroup = true
# 2. 配置Containerd使用国内Mirror站点上的pause镜像及指定的版本
[plugins."io.containerd.grpc.v1.cri"]
sandbox_image = "registry.aliyuncs.com/google_containers/pause:3.9"
# 3. 配置Containerd使用国内的Image加速服务 以加速Image获取
[plugins."io.containerd.grpc.v1.cri".registry]
[plugins."io.containerd.grpc.v1.cri".registry.mirrors]
[plugins."io.containerd.grpc.v1.cri".registry.mirrors."docker.io"]
endpoint = ["https://docker.mirrors.ustc.edu.cn", "https://registry.docker-cn.com"]
[plugins."io.containerd.grpc.v1.cri".registry.mirrors."registry.k8s.io"]
endpoint = ["https://registry.aliyuncs.com/google_containers"]
# 4. 配置Containerd使用私有镜像仓库 不存在要使用的私有ImageRegistry时 本步骤可省略
[plugins."io.containerd.grpc.v1.cri".registry]
[plugins."io.containerd.grpc.v1.cri".registry.mirrors]
[plugins."io.containerd.grpc.v1.cri".registry.mirrors."registry.minho.com"]
endpoint = ["https://registry.minho.com"]
# 5. 配置私有镜像仓库跳过tls验证 若私有ImageRegistry能正常进行tls认证 则本步骤可省略
[plugins."io.containerd.grpc.v1.cri".registry.configs]
[plugins."io.containerd.grpc.v1.cri".registry.configs."registry.minho.com".tls]
insecure_skip_verify = true
# 6. 重启服务
systemctl restart containerd
|
- 配置crictl客户端
- 安装containerd.io时 会自动安装命令行客户端工具crictl
- 该客户端通常需要通过正确的unix sock文件才能接入到containerd服务
- 编辑配置文件/etc/crictl.yaml 添加如下内容即可
- 随后即可正常使用crictl程序管理Image/Container和Pod等对象
- 另外containerd.io还有另一个名为ctr的客户端程序可以使用 其功能也更为丰富
1
2
3
4
| runtime-endpoint: unix:///run/containerd/containerd.sock
image-endpoint: unix:///run/containerd/containerd.sock
timeout: 10
debug: true
|
安装kubelet/kubeadm/kubectl
- 自v1.28版本开始 Kubernetes官方变更了仓库的存储路径及使用方式(不同的版本将会使用不同的仓库) 并提供了向后兼容至v1.24版本
- 因此 对于v1.24及之后的版本来说 可以使用如下有别于传统配置的方式来安装相关的程序包
- 以本示例中要安装的v1.29版本为例来说 配置要使用的程序包仓库 需要使用的命令如下
- 如若需要安装其它版本 则将下面命令中的版本号
v1.29予以替换即可
1
2
3
4
5
| apt-get update && apt-get install -y apt-transport-https
curl -fsSL https://mirrors.aliyun.com/kubernetes-new/core/stable/v1.29/deb/Release.key | gpg --dearmor -o /etc/apt/keyrings/kubernetes-apt-keyring.gpg
echo "deb [signed-by=/etc/apt/keyrings/kubernetes-apt-keyring.gpg] https://mirrors.aliyun.com/kubernetes-new/core/stable/v1.29/deb/ /" | tee /etc/apt/sources.list.d/kubernetes.list
apt-get update
apt-get install -y kubelet kubeadm kubectl
|
- 安装完成后 要确保kubeadm等程序文件的版本
- 这将也是后面初始化Kubernetes集群时需要明确指定的版本号
整合kubelet和cri-dockerd
- 仅支持CRI规范的kubelet需要经由遵循该规范的cri-dockerd完成与docker-ce的整合
- 该步骤仅使用docker-ce和cri-dockerd运行时的场景中需要配置
配置cri-dockerd
- 配置cri-dockerd 确保其能够正确加载到CNI插件
- 编辑
/usr/lib/systemd/system/cri-docker.service文件 确保其[Service]配置段中的ExecStart的值类似如下内容
1
| ExecStart=/usr/bin/cri-dockerd --container-runtime-endpoint fd:// --network-plugin=cni --cni-bin-dir=/opt/cni/bin --cni-cache-dir=/var/lib/cni/cache --cni-conf-dir=/etc/cni/net.d --pod-infra-container-image=registry.aliyuncs.com/google_containers/pause:3.9
|
- 需要添加的各配置参数(各参数的值要与系统部署的CNI插件的实际路径相对应)
--network-plugin 指定网络插件规范的类型 这里要使用CNI--cni-bin-dir 指定CNI插件二进制程序文件的搜索目录--cni-cache-dir CNI插件使用的缓存目录--cni-conf-dir CNI插件加载配置文件的目录--pod-infra-container-image Pod中的puase容器要使用的Image 默认为registry.k8s.io上的pause仓库中的镜像 不能直接获取到该Image时 要明确指定为从指定的位置加载 例如registry.aliyuncs.com/google_containers/pause:3.9- 配置完成后重启服务
systemctl restart cri-docker
配置kubelet
- 配置kubelet 为其指定cri-dockerd在本地打开的Unix Sock文件的路径
- 该路径一般默认为
/run/cri-dockerd.sock 编辑文件/etc/sysconfig/kubelet 为其添加如下指定参数- 若/etc/sysconfig目录不存在 则需要先创建该目录
KUBELET_KUBEADM_ARGS="--container-runtime=remote --container-runtime-endpoint=/run/cri-dockerd.sock"
初始化第一个主节点
- 该步骤开始尝试构建Kubernetes集群的master节点 配置完成后 各worker节点直接加入到集群中的即可
- 由于kubeadm部署的Kubernetes集群上 集群核心组件kube-apiserver、kube-controller-manager、kube-scheduler和etcd等均会以静态Pod的形式运行 它们所依赖的镜像文件默认来自于registry.k8s.io这一Registry服务之上
- 但我们无法直接访问该服务 常用的解决办法有如下两种
- 使用能够到达该服务的代理服务
- 使用国内的镜像服务器上的服务 例如
registry.aliyuncs.com/google_containers等
初始化master节点
- 在运行初始化命令之前先运行如下命令单独获取相关的镜像文件 而后再运行后面的
kubeadm init命令 以便于观察到镜像文件的下载过程 - 若您选择使用的是docker-ce和cri-dockerd这一容器运行时环境 本文后续内容中使用的kubeadm命令 都需要额外添加
--cri-socket=unix:///var/run/cri-dockerd.sock选项 以明确指定其所要关联的容器运行时 - 这是因为docker-ce和cri-dockerd都提供unix sock类型的socket地址 这会导致kubeadm在自动扫描和加载该类文件时无法自动判定要使用哪个文件 而使用containerd.io运行时 则不存在该类问题
 1
 2
 3
 4
 5
 6
 7
 8
 9
10
11
12
13
14
15
16
17
18
19
20
21
22
23
24
25
26
27
28
29
30
31
32
33
34
35
36
37
| # 下面的命令会列出类似如下的Image信息 由如下的命令结果可以看出
# 相关的Image都来自于registry.k8s.io 该服务上的Image通常需要借助于代理服务才能访问到
root@k8s-master01:~# kubeadm config images list
registry.k8s.io/kube-apiserver:v1.29.13
registry.k8s.io/kube-controller-manager:v1.29.13
registry.k8s.io/kube-scheduler:v1.29.13
registry.k8s.io/kube-proxy:v1.29.13
registry.k8s.io/coredns/coredns:v1.11.1
registry.k8s.io/pause:3.9
registry.k8s.io/etcd:3.5.16-0
# 若需要从国内的Mirror站点下载Image
# 还需要在命令上使用--image-repository选项来指定Mirror站点的相关URL
# 例如 下面的命令中使用了该选项将Image Registry指向国内可用的Aliyun的镜像服务
# 其命令结果显示的各Image也附带了相关的URL
root@k8s-master01:~# kubeadm config images list --image-repository=registry.aliyuncs.com/google_containers
registry.aliyuncs.com/google_containers/kube-apiserver:v1.29.13
registry.aliyuncs.com/google_containers/kube-controller-manager:v1.29.13
registry.aliyuncs.com/google_containers/kube-scheduler:v1.29.13
registry.aliyuncs.com/google_containers/kube-proxy:v1.29.13
registry.aliyuncs.com/google_containers/coredns:v1.11.1
registry.aliyuncs.com/google_containers/pause:3.9
registry.aliyuncs.com/google_containers/etcd:3.5.16-0
# 运行下面的命令即可下载需要用到的各Image
# 需要注意的是 如果需要从国内的Mirror站点下载Image
# 同样需要在命令上使用--image-repository选项来指定Mirror站点的相关URL
kubeadm config images pull --image-repository=registry.aliyuncs.com/google_containers
---
[config/images] Pulled registry.aliyuncs.com/google_containers/kube-apiserver:v1.29.13
[config/images] Pulled registry.aliyuncs.com/google_containers/kube-controller-manager:v1.29.13
[config/images] Pulled registry.aliyuncs.com/google_containers/kube-scheduler:v1.29.13
[config/images] Pulled registry.aliyuncs.com/google_containers/kube-proxy:v1.29.13
[config/images] Pulled registry.aliyuncs.com/google_containers/coredns:v1.11.1
[config/images] Pulled registry.aliyuncs.com/google_containers/pause:3.9
[config/images] Pulled registry.aliyuncs.com/google_containers/etcd:3.5.16-0
|
- 而后即可进行master节点初始化
- kubeadm init命令支持两种初始化方式
- 一是通过命令行选项传递关键的部署设定
- 另一个是基于yaml格式的专用配置文件(建议)
- 后一种允许用户自定义各个部署参数 在配置上更为灵活和便捷 下面分别给出了两种实现方式的配置步骤 建议读者采用第二种方式进行。
方式1
- 运行如下命令完成k8s-master01节点的初始化
- 需要注意的是 若使用docker-ce和cri-dockerd运行时 则还要在如下命令上明确配置使用
--cri-socket=unix:///run/cri-dockerd.sock选项
1
2
3
4
5
6
7
8
| kubeadm init \
--control-plane-endpoint="k8s-master01.minho.com" \
--kubernetes-version=v1.29.13 \
--pod-network-cidr=10.244.0.0/16 \
--service-cidr=10.96.0.0/12 \
--token-ttl=0 \
--upload-certs \
--cri-socket=unix:///run/cri-dockerd.sock
|
- 各选项含义
--image-repository 指定要使用的镜像仓库 默认为registry.k8s.io--kubernetes-version kubernetes程序组件的版本号 它必须要与安装的kubelet程序包的版本号相同--control-plane-endpoint 控制平面的固定访问端点 可以是IP地址或DNS名称 会被用于集群管理员及集群组件的kubeconfig配置文件的API Server的访问地址 单控制平面部署时可以不使用该选项--pod-network-cidr Pod网络的地址范围 其值为CIDR格式的网络地址 通常Flannel网络插件的默认为10.244.0.0/16 Calico插件的默认值为192.168.0.0/16 而Cilium的默认值为10.0.0.0/8--service-cidr Service的网络地址范围 其值为CIDR格式的网络地址 kubeadm使用的默认为10.96.0.0/12 通常 仅在使用Flannel一类的网络插件需要手动指定该地址--apiserver-advertise-address apiserver通告给其他组件的IP地址 一般应该为Master节点的用于集群内部通信的IP地址 0.0.0.0表示节点上所有可用地址--token-ttl 共享令牌(token)的过期时长 默认为24小时 0表示永不过期 为防止不安全存储等原因导致的令牌泄露危及集群安全 建议为其设定过期时长 未设定该选项时 在token过期后 若期望再向集群中加入其它节点 可以使用如下命令重新创建token 并生成节点加入命令kubeadm token create --print-join-command
- 提示:无法访问
registry.k8s.io时 同样可以在上面的命令中使用--image-repository=registry.aliyuncs.com/google_containers选项 以便从国内的镜像服务中获取各Image - 注意:若各节点未禁用Swap设备 还需要附加选项
--ignore-preflight-errors=Swap 从而让kubeadm忽略该错误设定
方式二
- kubeadm也可通过配置文件加载配置 以定制更丰富的部署选项 获取内置的初始配置文件的命令
kubeadm config print init-defaults- 下面的配置示例 是以上面命令的输出结果为框架进行修改的 它明确定义了kubeProxy的模式为ipvs 并支持通过修改imageRepository的值修改获取系统镜像时使用的镜像仓库
 1
 2
 3
 4
 5
 6
 7
 8
 9
10
11
12
13
14
15
16
17
18
19
20
21
22
23
24
25
26
27
28
29
30
31
32
33
34
35
36
37
38
39
40
41
42
43
44
45
46
47
48
49
50
51
52
53
54
55
56
57
58
59
60
61
| apiVersion: kubeadm.k8s.io/v1beta3
bootstrapTokens:
- groups:
- system:bootstrappers:kubeadm:default-node-token
token: minho.comc4mu9kzd5q7ur
ttl: 24h0m0s
usages:
- signing
- authentication
kind: InitConfiguration
localAPIEndpoint:
# 这里的地址即为初始化的控制平面第一个节点的IP地址
advertiseAddress: 172.29.7.1
bindPort: 6443
nodeRegistration:
# 注意 使用docker-ce和cri-dockerd时 要启用如下配置的cri socket文件的路径
# criSocket: unix:///run/cri-dockerd.sock
imagePullPolicy: IfNotPresent
# 第一个控制平面节点的主机名称
name: k8s-master01.minho.com
taints:
- effect: NoSchedule
key: node-role.kubernetes.io/master
- effect: NoSchedule
key: node-role.kubernetes.io/control-plane
---
apiServer:
timeoutForControlPlane: 4m0s
# 将下面配置中的certSANS列表中的值 修改为客户端接入API Server时可能会使用的各类目标地址
certSANs:
- kubeapi.minho.com
- 172.29.7.1
- 172.29.7.2
- 172.29.7.3
- 172.29.7.253
apiVersion: kubeadm.k8s.io/v1beta3
# 控制平面的接入端点 我们这里选择适配到kubeapi.minho.com这一域名上
controlPlaneEndpoint: "kubeapi.minho.com:6443"
certificatesDir: /etc/kubernetes/pki
clusterName: kubernetes
controllerManager: {}
dns: {}
etcd:
local:
dataDir: /var/lib/etcd
imageRepository: registry.aliyuncs.com/google_containers
kind: ClusterConfiguration
kubernetesVersion: v1.29.2
networking:
# 集群要使用的域名 默认为cluster.local
dnsDomain: cluster.local
# service网络的地址
serviceSubnet: 10.96.0.0/12
# pod网络的地址 flannel网络插件默认使用10.244.0.0/16
podSubnet: 10.244.0.0/16
scheduler: {}
---
apiVersion: kubeproxy.config.k8s.io/v1alpha1
kind: KubeProxyConfiguration
# 用于配置kube-proxy上为Service指定的代理模式 默认为iptables
mode: "ipvs"
|
- 将上面的内容保存于配置文件中 例如kubeadm-config.yaml
- 而后执行如下命令即能实现类似前一种初始化方式中的集群初始配置 但这里将Service的代理模式设定为ipvs
kubeadm init --config kubeadm-config.yaml --upload-certs
初始化完成后的操作步骤
- 对于Kubernetes系统的新用户来说 无论使用上述哪种方法 命令运行结束后 请记录最后的kubeadm join命令输出的最后提示的操作步骤
- 下面的内容是需要用户记录的一个命令输出示例 它提示了后续需要的操作步骤
 1
 2
 3
 4
 5
 6
 7
 8
 9
10
11
12
13
14
15
16
17
18
19
20
21
22
23
24
25
26
27
28
29
30
31
32
| Your Kubernetes control-plane has initialized successfully!
To start using your cluster, you need to run the following as a regular user:
mkdir -p $HOME/.kube
sudo cp -i /etc/kubernetes/admin.conf $HOME/.kube/config
sudo chown $(id -u):$(id -g) $HOME/.kube/config
Alternatively, if you are the root user, you can run:
export KUBECONFIG=/etc/kubernetes/admin.conf
You should now deploy a pod network to the cluster.
Run "kubectl apply -f [podnetwork].yaml" with one of the options listed at:
https://kubernetes.io/docs/concepts/cluster-administration/addons/
You can now join any number of the control-plane node running the following command on each as root:
kubeadm join k8s-master01.minho.com:6443 --token tkzmlw.406h8d9g8x9sf8z1 \
--discovery-token-ca-cert-hash sha256:a32fe9b88096c3c0c22570a486302f58d3c479a8f1ccaf74b8fa4538a1a9d904 \
--control-plane --certificate-key 502f1f1c87aea5a99dea3ee197878159f06a1f4178a8e7610ed228e6629a9414 \
--cri-socket=unix:///run/cri-dockerd.sock
Please note that the certificate-key gives access to cluster sensitive data, keep it secret!
As a safeguard, uploaded-certs will be deleted in two hours; If necessary, you can use
"kubeadm init phase upload-certs --upload-certs" to reload certs afterward.
Then you can join any number of worker nodes by running the following on each as root:
kubeadm join k8s-master01.minho.com:6443 --token tkzmlw.406h8d9g8x9sf8z1 \
--discovery-token-ca-cert-hash sha256:a32fe9b88096c3c0c22570a486302f58d3c479a8f1ccaf74b8fa4538a1a9d904 \
--cri-socket=unix:///run/cri-dockerd.sock
|
kubeadm init命令完整参考指南请移步官方文档
设定kubectl
- kubectl是kube-apiserver的命令行客户端程序 实现了除系统部署之外的几乎全部的管理操作 是kubernetes管理员使用最多的命令之一
- kubectl需经由API server认证及授权后方能执行相应的管理操作 kubeadm部署的集群为其生成了一个具有管理员权限的认证配置文件/etc/kubernetes/admin.conf
- 它可由kubectl通过默认的
$HOME/.kube/config的路径进行加载 当然 用户也可在kubectl命令上使用–kubeconfig选项指定一个别的位置 - 下面复制认证为Kubernetes系统管理员的配置文件至目标用户(例如当前用户root)的家目录下
mkdir ~/.kube && cp /etc/kubernetes/admin.conf ~/.kube/config
部署网络插件
- Kubernetes系统上Pod网络的实现依赖于第三方插件进行 这类插件有近数十种之多 较为著名的有flannel、calico、canal和kube-router等 简单易用的实现为CoreOS提供的flannel项目
- 下面的命令用于在线部署flannel至Kubernetes系统之上 我们需要在初始化的第一个master节点k8s-master01上运行如下命令 以完成部署
kubectl apply -f https://github.com/flannel-io/flannel/releases/latest/download/kube-flannel.yml- 而后使用如下命令确认其输出结果中Pod的状态为
Running 类似如下命令及其输入的结果所示 kubectl get pods -n kube-flannel
验证master节点已经就绪
 1
 2
 3
 4
 5
 6
 7
 8
 9
10
11
12
13
14
| kubectl get nodes
# 上述命令应该会得到类似如下输出 这表示k8s-master01节点已经就绪
NAME STATUS ROLES AGE VERSION
k8s-master01.minho.com Ready control-plane 5d22h v1.29.12
# 若准备有其它的master节点 以构建高可用的控制平面
# 可按照初始化控制平面第一个节点时输出的信息 在额外的master节点上运行添加命令 以完成控制平面其它节点的添加
# 相关的命令是形如下在的相关信息
kubeadm join k8s-master01.minho.com:6443 \
--token tkzmlw.406h8d9g8x9sf8z1 \
--discovery-token-ca-cert-hash sha256:a32fe9b88096c3c0c22570a486302f58d3c479a8f1ccaf74b8fa4538a1a9d904 \
--control-plane --certificate-key 502f1f1c87aea5a99dea3ee197878159f06a1f4178a8e7610ed228e6629a9414 \
--cri-socket=unix:///run/cri-dockerd.sock
|
添加节点到集群中
验证节点添加结果
- 在每个节点添加完成后 即可通过kubectl验证添加结果
- 下面的命令及其输出是在所有的三个节点均添加完成后运行的 其输出结果表明三个Worker Node已经准备就绪
1
2
3
4
5
6
| root@k8s-master01:~# kubectl get nodes
NAME STATUS ROLES AGE VERSION
k8s-master01.minho.com Ready control-plane 5d22h v1.29.12
k8s-node01.minho.com Ready <none> 5d22h v1.29.12
k8s-node02.minho.com Ready <none> 5d22h v1.29.12
k8s-node03.minho.com Ready <none> 5d22h v1.29.12
|
测试应用编排及服务访问
- 到此为止 一个master/三个worker的kubernetes集群基础设施已经部署完成 用户随后即可测试其核心功能
- 例如 下面的命令可将demoapp以Pod的形式编排运行于集群之上 并通过在集群外部进行访问
1
2
3
4
5
6
7
| kubectl create deployment demoapp --image=ikubernetes/demoapp:v1.0 --replicas=3
kubectl create service nodeport demoapp --tcp=80:80
# 而后 使用如下命令了解Service对象demoapp使用的NodePort 以便于在集群外部进行访问
root@k8s-master01:~# kubectl get svc -l app=demoapp
NAME TYPE CLUSTER-IP EXTERNAL-IP PORT(S) AGE
demoapp NodePort 10.100.84.12 <none> 80:30622/TCP 2s
|
- demoapp是一个web应用 因此 用户可以于集群外部通过
http://NodeIP:30622这个URL访问demoapp上的应用 - 我们也可以在Kubernetes集群上启动一个临时的客户端 对demoapp服务发起访问测试
kubectl run client-$RANDOM --image=ikubernetes/admin-box:v1.2 --rm --restart=Never -it --command -- /bin/bash- 而后 在打开的交互式接口中 运行如下命令 对demoapp.default.svc服务发起访问请求 验证其负载均衡的效果
root@client-3021 ~# while true; do curl demoapp.default.svc; sleep 1; done- 清理部署的测试应用
kubectl delete deployments/demoapp services/demoapp
部署Add-ons(可选步骤)
1
2
3
4
5
6
7
8
9
10
11
12
13
14
15
16
17
18
19
20
21
22
23
24
25
| # 安装metalLB
kubectl apply -f https://raw.githubusercontent.com/metallb/metallb/v0.14.9/config/manifests/metallb-native.yaml
# 配置地址池
# IPAddressPool: 用来定义可分配的IP范围
# L2Advertisement: 在Layer2模式下通过ARP广播来承诺这些IP
apiVersion: metallb.io/v1beta1
kind: IPAddressPool
metadata:
name: default-pool
namespace: metallb-system
spec:
addresses:
- 192.168.1.240-192.168.1.250
---
apiVersion: metallb.io/v1beta1
kind: L2Advertisement
metadata:
name: l2-adv
namespace: metallb-system
spec:
ipAddressPools:
- default-pool
# 接下来就可以创建LoadBalancer类型的Service使用
|
- Ingress Nginx
- Metrics Server
- Kuboard
配置对多集群的访问
配置对多集群的访问
1
2
3
4
5
6
7
8
9
10
11
12
13
14
15
16
17
18
19
20
21
| # 添加集群信息
kubectl config --kubeconfig=config-demo set-cluster development --server=https://1.2.3.4 --certificate-authority=fake-ca-file
# 添加用户信息
kubectl config --kubeconfig=config-demo set-credentials developer --client-certificate=fake-cert-file --client-key=fake-key-seefile
# 添加上下文
kubectl config --kubeconfig=config-demo set-context dev-frontend --cluster=development --namespace=frontend --user=developer
# 查看配置文件详情
# 直接打开文件或使用如下命令
kubectl config --kubeconfig=config-demo view
# 设置当前上下文
kubectl config --kubeconfig=config-demo use-context dev-frontend
# 使用--minify参数 来查看与当前上下文相关联的配置信息
kubectl config --kubeconfig=config-demo view --minify
# 设置 KUBECONFIG 环境变量
export KUBECONFIG="${KUBECONFIG}:config-demo:config-demo-2"
|
资源清单定义
Pod
pods
自主式Pod
1
2
3
4
5
6
7
8
9
10
11
12
13
14
15
16
17
18
| apiVersion: v1
kind: Pod
metadata:
name: pod-demo
namespace: default
labels:
app: myapp
tier: frontend
spec:
containers:
- name: myapp
image: nginx:alpine
- name: busybox
image: busybox:latest
command:
- "/bin/sh"
- "-c"
- "sleep 3600"
|
Pod资源
spec.containers <[]object>
1
2
3
4
5
6
7
8
9
| # kubectl explain pod.spec.containers
- name: <string>
image: <string>
imagePullPolicy: <string> # Always Never IfNotPresent
...
# 修改镜像中的默认应用
- command/args
https://kubernetes.io/docs/tasks/inject-data-application/define-command-argument-container/
|
标签
- key = value
- key: 字母 数字 _ - .
- value: 可以为空 只能字母或数字开头及结尾
标签选择器
- 等值关系: =、==、!=(不等于会筛选出不具有该标签的资源)
- 集合关系
- KEY in (VALUE1,VALUE2,…)
- KEY notin (VALUE1,VALUE2,…)
- KEY # 存在这个KEY就行
- !KEY # 不存在此键的资源
许多资源支持内嵌字段来使用标签选择器
- matchLabels: 直接给定键值
- matchExpressions: 基于给定的表达式来定义使用标签选择器
- key: “KEY”, operator: “OPERATOR”, values: [VAL1,VAL2,VAL3,…]
- 操作符
- In、NotIn: values字段的值必须为非空列表
- Exists、NotExists: values字段的值必须为空列表
spec.nodeSelector <map[striong]string>
spec.nodeName <string> # 直接指定运行node
annotations
- 与label不同的地方在于 它不能用于挑选资源对象 仅用于为对象提供元数据
- 没有键长度/值长度限制
spec.restartPolicy
- 重启策略: One of Always, OnFailure, Never. Default to Always
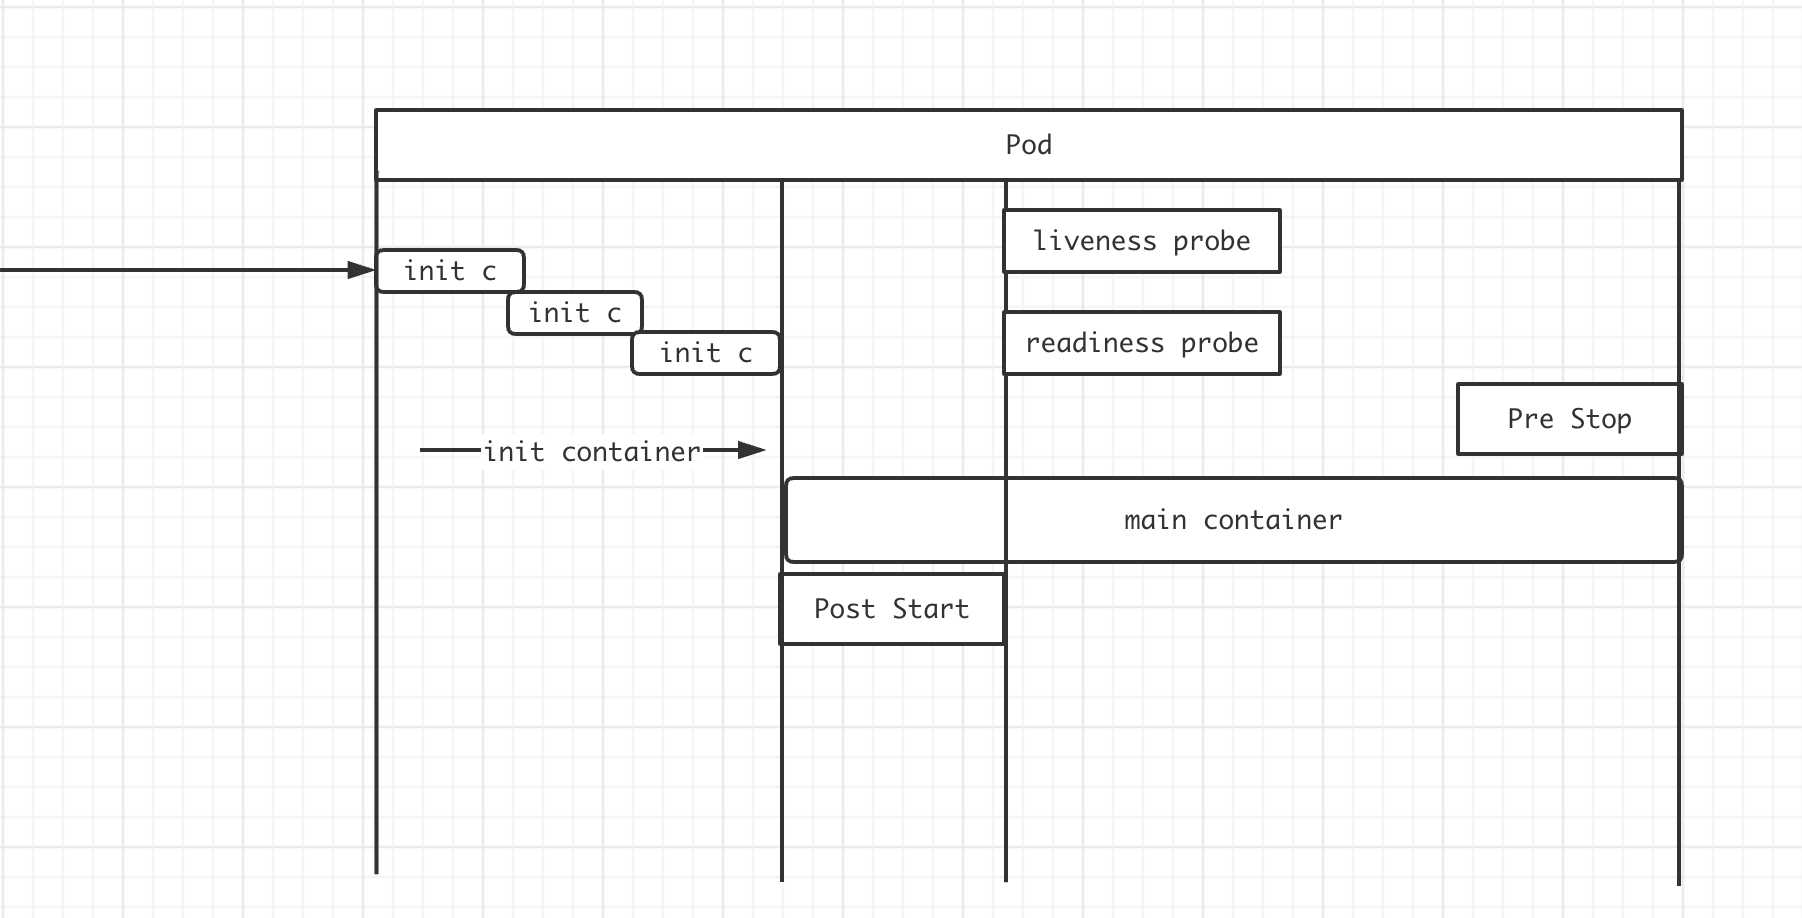
Pod生命周期
pod-lifecycle
状态
- Pending # 调度尚未完成
- Running # 运行状态
- Failed
- Succeeded
- Unknown
- …
Pod生命周期中的重要行为
- 初始化容器
- 按顺序同步执行
- 执行成功才会继续执行下一个
- 若某一个执行失败 会全部重新执行
- 初始化容器具有阻塞的特性 初始化容器不执行完成 则阻塞着主容器的启动
- 容器探测(自定义命令/TCP套接字发请求/HTTP应用层请求)
- start probe: 启动探测
- liveness probe: 探测容器是否存活
- readiness probe: 探测容器是否准备就绪 能对外提供服务
- 钩子
- post start
- 启动后钩子 在初始化容器执行完成 开始初始化主容器时 就会启动
- 所以 并不保证在主容器启动命令执行完成后再执行
- 有可能启动命令耗时较久 但是post start钩子已经执行完成
- pre stop
preStop钩子延伸
- 在k8s中 理想的状态是pod优雅释放 但并不是每一个pod都会如此顺利
- pod卡死 处理不了优雅退出的命令或操作
- 优雅退出的逻辑有bug 陷入死循环
- 代码问题 导致执行的命令没有效果
- 对于以上问题 k8s的终止流程中还有一个 最多可以容忍的时间" 即
grace period - 在
pod.spec.termiationGracePeriodSeconds字段定义 默认值为30s - 当我们执行
kubelet delete的时候 也可以加上--grace-period参数显示指定一个优雅退出时间来覆盖pod中的配置 - 如果我们配置的
grace period超过时间之后 k8s就只能强制kill pod - 值得注意的是 这与preStop hook和SIGTERM信号并行发生 k8s不会等待preStop hook的完成 如果你的应用程序完成关闭并在
terminationGracePeriod完成之前退出 k8s会立即进入下一步
初始化容器
init-cotainers
- init容器与普通容器非常像 除以下2点
- init容器总是运行到成功完成为止
- 每个init容器都必须在下一个init容器启动之前成功完成
- 如果Pod的init容器失败 Kubernetes会不断的重启该Pod知道init容器成功为止
- 然后 如果Pod对应的
restartPolicy为Never 它不会重新启动 - initC与应用容器具备不同的镜像 可以把一些危险的工具放置在initC中 进行使用
- initC多个之间时线形启动的 所以可以做一些延迟性的操作
- initC不支持
lifeycle 探针 其他与应用容器无异
实验
- 下面的例子定义了一个具有2个Init容器的简单Pod
- 第一个等待myservice启动
- 第二个等待mydb启动
- 一旦这两个Init容器都启动完成 Pod将启动spec节中的应用容器
 1
 2
 3
 4
 5
 6
 7
 8
 9
10
11
12
13
14
15
16
17
18
19
20
21
22
23
24
25
26
27
28
| apiVersion: v1
kind: Pod
metadata:
name: initc-1
labels:
app: initc
spec:
containers:
- name: myapp-container
image: busybox
command:
- "sh"
- "-c"
- "echo The app is running && sleep 3600"
initContainers:
- name: init-myservice
image: busybox
command:
- "sh"
- "-c"
- "until nslookup myservice; do echo waiting for myservice; sleep 2; done;"
- name: init-mydb
image: wangyanglinux/tools:busybox
command:
- "sh"
- "-c"
- "until nslookup mydb; do echo waiting for mydb; sleep2; done;"
|
 1
 2
 3
 4
 5
 6
 7
 8
 9
10
11
12
13
14
15
16
17
18
19
20
21
22
23
24
25
| # kubectl apply -f initc.yaml
# 查看容器状态可以看到 目前卡在Init阶段 等待2个初始化容器的成功退出
# kubectl get -f initc.yaml
NAME READY STATUS RESTARTS AGE
initc-1 0/1 Init:0/2 0 35m
# 查看容器日志看到 应用容器在等待初始化 因为初始化容器阻塞了应用容器
# kubectl logs -f initc-1
Defaulted container "myapp-container" out of: myapp-container, init-myservice (init), init-mydb (init)
Error from server (BadRequest): container "myapp-container" in pod "initc-1" is waiting to start: PodInitializing
# 也可以单独查看初始化容器的日志
# kubectl logs -f initc-1 -c init-myservice
Server: 10.96.0.10
Address: 10.96.0.10:53
** server can not find myservice.default.svc.cluster.local: NXDOMAIN
...
waiting for myservice
# 第二个初始化容器也被阻塞
# kubectl logs -f initc-1 -c init-db
Error from server (BadRequest): container "init-mydb" in pod "initc-1" is waiting to start: PodInitializing
|
- 增加对应service后 则init容器成功执行 应用容器正常初始化
 1
 2
 3
 4
 5
 6
 7
 8
 9
10
11
12
13
14
15
16
17
18
19
20
| ---
apiVersion: v1
kind: Service
metadata:
name: myservice
spec:
ports:
- protocol: TCP
port: 80
targetPort: 9376
---
apiVersion: v1
kind: Service
metadata:
name: mydb
spec:
ports:
- protocol: TCP
port: 80
targetPort: 9377
|
Pod容器探针类型
配置探针
kubectl explain pod.spec.containers.livenessProbe
kubectl explain pod.spec.containers.readinessProbe
- exec Action
- httpGet Action
- tcpSocket Action
Pod控制器
控制器
工作负载管理
ReplicaSet
- Kubectl explain replicaset
- 用户期望副本数 标签选择器 Pod资源模版
- 不建议直接使用ReplicaSet
1
2
3
4
5
6
7
8
9
10
11
12
13
14
15
16
17
18
19
20
21
22
23
24
25
| apiVersion: apps/v1
kind: ReplicaSet
metadata:
name: myapp
namespace: default
spec:
replicas: 2
selector:
matchLabels:
app: myapp
release: canary
template:
metadata:
name: myapp-pod
labels:
app: myapp
release: canary
environment: qa
spec:
containers:
- name: myapp-container
image: nginx:alpine
ports:
- name: http
containerPort: 80
|
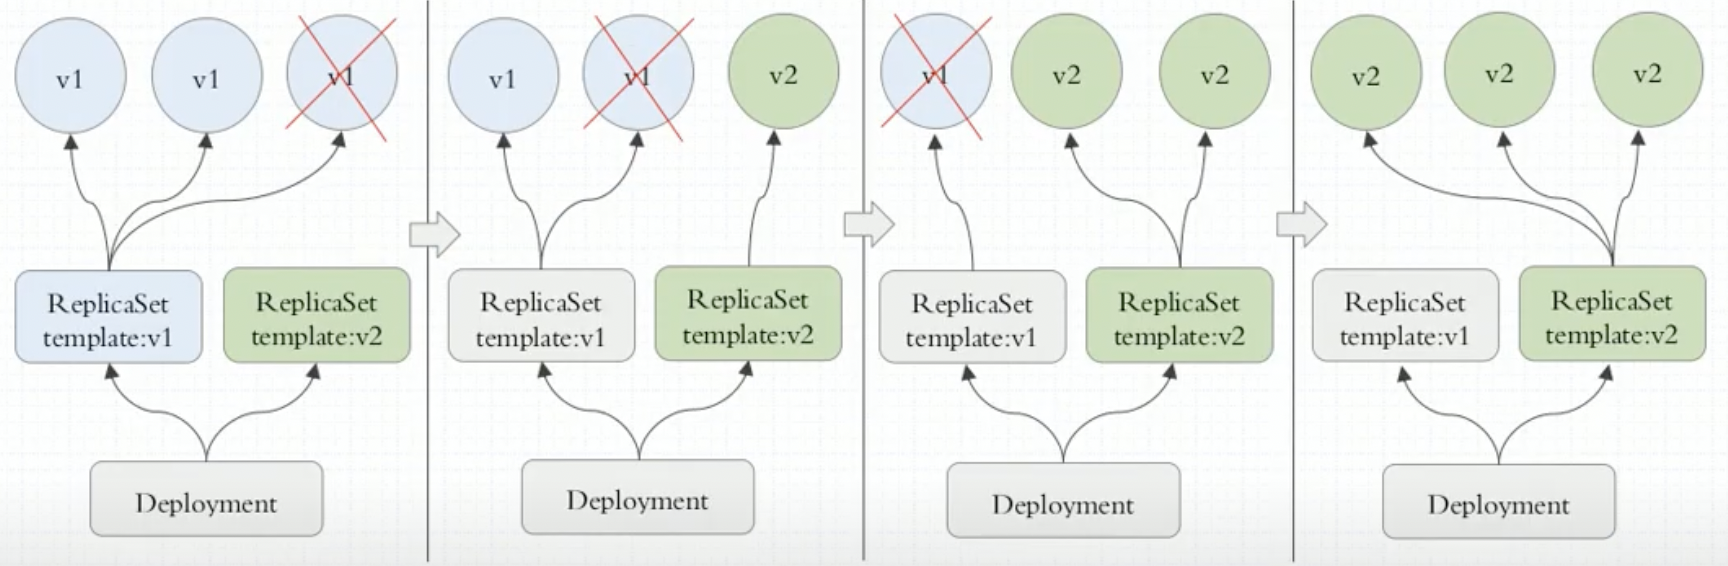
Deployment
- 构建在ReplicaSet之上 而非Pod
- 实现滚动更新(多出或少于N个副本 控制更新粒度)、回滚
- 通常管理10个历史版本(ReplicaSet)
- 管理无状态应用最好的控制器
- 无状态(只关注群体、不关注个体)、持续运行应用
- 声明式管理(即可以创建 也可以更新
kubectl apply -f deployment.yaml) kubectl rollout history 查看滚动历史kubectl rollout --help 查看rollout所有子命名帮助- 注意:
kubectl rollout restart deployment/abc # 重启Pod 实际是滚动更新 删掉重建新的Pod
Service
Service代理
services-networking
- userspace
- kube-proxy会监视Kubernetes控制平面对Service对象和Endpoints对象的添加和移除操作
- 对每个Service它会在本地Node上打开一个端口(随机选择) 任何连接到代理端口的请求 都会被代理到Service的后端
Pods中的某个上面- 使用哪个后端Pod是 kube-proxy 基于
SessionAffinity来确定的
- 最后 它配置 iptables 规则 捕获到达该 Service 的
clusterIP(是虚拟 IP)和Port的请求 并重定向到代理端口 代理端口再代理请求到后端Pod- 默认情况下 用户空间模式下的kube-proxy通过轮转算法选择后端
- 流量来回在内核和用户空间切换 效率较低

- iptables
kube-proxy会监视Kubernetes控制节点对Service对象和Endpoints对象的添加和移除
对每个Service 它会配置iptables规则 从而捕获到达该Service的clusterIP和端口的请求 进而将请求重定向到 Service 的一组后端中的某个Pod上面
对于每个Endpoints对象 它也会配置iptables规则 这个规则会选择一个后端组合
- 默认的策略是 kube-proxy在iptables模式下随机选择一个后端
使用iptables处理流量具有较低的系统开销 因为流量由Linux netfilter处理 而无需在用户空间和内核空间之间切换 这种方法也可能更可靠
如果kube-proxy在iptables模式下运行 并且所选的第一个 Pod 没有响应 则连接失败
- 这与用户空间模式不同: 在这种情况下 kube-proxy将检测到与第一个Pod的连接已失败 并会自动使用其他后端Pod 重试
- 可以使用Pod就绪探测器 验证后端Pod可以正常工作 以便iptables模式下的kube-proxy仅看到测试正常的后端 避免将流量通过kube-proxy发送到已知已失败的 Pod

- ipvs
特性状态: Kubernetes v1.11 [stable]
在ipvs模式下 kube-proxy监视Kubernetes服务和端点 调用netlink接口创建相应的IPVS规则 并定期将IPVS规则与Kubernetes服务和端点同步 该控制循环可确保 IPVS 状态与所需状态匹配
访问服务时 IPVS将流量定向到后端Pod之一
IPVS代理模式基于类似于iptables模式的netfilter挂钩函数 但是使用哈希表作为基础数据结构 并且在内核空间中工作
- 这意味着 与iptables模式下的kube-proxy相比 IPVS模式下的kube-proxy重定向通信的延迟要短 并且在同步代理规则时具有更好的性能
- 与其他代理模式相比 IPVS模式还支持更高的网络流量吞吐量
IPVS提供了更多选项来平衡后端Pod的流量
rr: 轮询(Round-Robin)lc: 最少链接(Least Connection) 即打开链接数量最少者优先dh: 目标地址哈希(Destination Hashing)sh: 源地址哈希(Source Hashing)sed: 最短预期延迟(Shortest Expected Delay)nq: 从不排队(Never Queue)
备注
- 要在IPVS模式下运行kube-proxy必须在启动kube-proxy之前使IPVS在节点上可用
- 当kube-proxy以IPVS代理模式启动时 它将验证IPVS内核模块是否可用
- 如果未检测到IPVS内核模块 则kube-proxy将退回到以iptables代理模式运行

Service类型
- ClusterIP: 通过集群的内部IP暴露服务 选择该值时服务只能够在集群内部访问 这也是默认的
ServiceType - NodePort: 通过每个节点上的IP和静态端口(NodePort)暴露服务 NodePort服务会路由到自动创建的ClusterIP服务
- 通过请求
<节点IP>:<节点端口> 你可以从集群的外部访问一个NodePort服务 - Client -> NodeIP:NodePort -> ClusterIP:ServicePort -> PodIP:containerPort
- 为避免单Node压力过大 会在外面再加一层负载均衡
- 公有云环境: LBaaS(参考下面LoadBalancer类型)
- LoadBalancer: 使用云提供商的负载均衡器向外部暴露服务 外部负载均衡器可以将流量路由到自动创建的NodePort服务和ClusterIP服务上
- ExternalName: 通过返回CNAME和对应值 可以将服务映射到externalName字段的内容(例如
foo.bar.example.com) 无需创建任何类型代理- FQDN(CoreDNS 内部解析)
- CNAME -> FQDN(外部真正的FQDN )
Headless Services(无头Service)
- 有时不需要或不想要负载均衡 以及单独的Service IP 遇到这种情况 可以通过指定Cluster IP(
spec.clusterIP)的值为 "None"来创建 Headless Service - 你可以使用一个无头Service与其他服务发现机制进行接口 而不必与Kubernetes的实现捆绑在一起
- 对于无头
Services并不会分配Cluster IP kube-proxy不会处理它们 而且平台也不会为它们进行负载均衡和路由 DNS如何实现自动配置 依赖于Service是否定义了选择算符 - 无头Service允许客户端直接连接到它所偏好的任一Pod 无头Service不使用虚拟IP地址和代理配置路由和数据包转发 相反 无头Service通过内部DNS记录报告各个Pod的端点IP地址 这些DNS记录是由集群的DNS服务所提供 要定义无头 Service 你需要将
.spec.type设置为ClusterIP(这也是type的默认值) 并进一步将.spec.clusterIP设置为 None
流量策略
traffic-policies
会话亲和性
session-affinity
- 在这些代理模型中 绑定到
Service IP:Port的流量被代理到合适的后端 客户端不需要知道任何关于Kubernetes、Service或Pod的信息 - 如果要确保来自特定客户端的连接每次都传递给同一个Pod 你可以通过设置Service的
.spec.sessionAffinity为ClientIP来设置基于客户端IP地址的会话亲和性 - 默认为
None
会话粘性超时
- 你还可以通过设置Service的
.spec.sessionAffinityConfig.clientIP.timeoutSeconds来设置最大会话粘性时间 - 默认值为10800 即3小时
- 说明:在Windows上不支持为Service设置最大会话粘性时间
Ingress
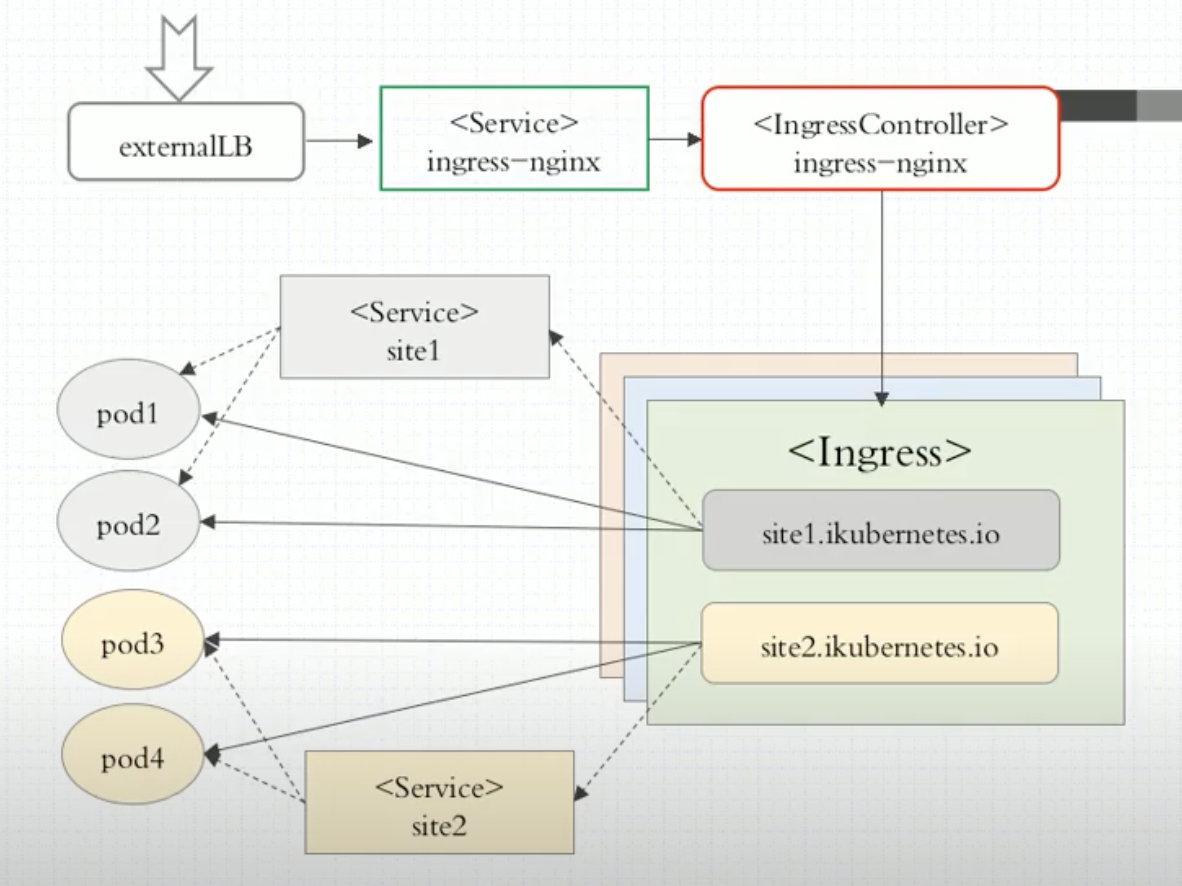
ingress
- Service对后端特定类型Pod分类(label selector)
- Ingress基于上面的分类识别后端Pod 并生成配置信息注入到nginx(需要重载配置)/envoy/traefik等
ingress-controllers
存储
kubernetes-storage
kubectl explain pods.spec.volumes
- emptyDir # 临时目录 随pod删除而消失(生命周期同pod)
- gitRepo(clone到机器 修改不会同步 需要同步可以自己再做一个sidecar)
- hostPath # 宿主机路径
- SAN(iSCSI…)、NAS(nfs、cifs…)
- 分布式存储
- 云存储
- 存储各类特性
- 元数据
- configMap: 用于保存配置数据(明文)
- secret: 用于保存敏感数据(编码)
- downwardAPI: 容器在运行时从KubernetesAPI服务器获取有关它们自身的信息
- 真实数据
- volume: 用于存储临时或者持久性数据
- persistentVolume: 申请制的持久化存储
configMap
- configMap是一种 API 对象 用来将非机密性的数据保存到键值对中
- 使用时Pods可以将其用作环境变量、命令行参数或者存储卷中的配置文件
- configMap将你的环境配置信息和容器镜像解耦 便于应用配置的修改
容器化配置应用方式
- 自定义命令行参数
- 把配置文件直接打包至镜像
- 环境变量
- CloudNative的应用程序一般可直接通过环境变量加载配置
- 通过entrypoint脚本来预处理变量为配置文件中的配置信息
- 存储卷
基于目录创建
1
2
3
4
5
6
7
8
9
10
11
12
13
14
15
16
17
18
19
20
21
| # game.properties
enemies=aliens
lives=3
enemies.cheat=true
enemies.cheat.level=noGoodRotten
secret.code.passphrase=UUDDLRLRBABAS
secret.code.allowed=true
secret.code.lives=30
# ui.properties
color.good=purple
color.bad=yellow
allow.textmode=true
how.nice.to.look=fairlyNice
# game-env-file.properties
enemies=aliens
lives=3
allowed="true"
# This comment and the empty line above it are ignored
|
1
2
3
4
5
| # 从configMap目录创建
kubectl create configmap game-config --from-file=configMap/
# 查看内容
kubectl describe configmaps game-config
|
1
2
3
4
5
6
7
8
9
10
11
12
13
14
15
16
17
18
19
20
21
22
23
| # kubectl get configmaps game-config -o yaml
apiVersion: v1
data:
game.properties: |
enemies=aliens
lives=3
enemies.cheat=true
enemies.cheat.level=noGoodRotten
secret.code.passphrase=UUDDLRLRBABAS
secret.code.allowed=true
secret.code.lives=30
ui.properties: |
color.good=purple
color.bad=yellow
allow.textmode=true
how.nice.to.look=fairlyNice
kind: ConfigMap
metadata:
creationTimestamp: "2025-05-06T11:17:42Z"
name: game-config
namespace: default
resourceVersion: "15745032"
uid: 339da6be-8725-4c71-895d-33b6b29937c1
|
基于文件创建
1
2
3
4
5
| # 你可以使用 kubectl create configmap 基于单个文件或多个文件创建 ConfigMap
kubectl create configmap game-config-2 --from-file=configMap/game.properties
# 你可以多次使用 --from-file 参数 从多个数据源创建 ConfigMap
kubectl create configmap game-config-2 --from-file=configMap/game.properties --from-file=configMap/ui.properties
|
1
2
3
4
5
6
7
8
9
10
11
12
13
14
15
16
17
18
19
20
| # 使用 --from-env-file 选项基于 env 文件创建 ConfigMap
# Env 文件包含环境变量列表 其中适用以下语法规则:
# Env 文件中的每一行必须为 VAR=VAL 格式
# 以#开头的行(即注释)将被忽略
# 空行将被忽略
# 引号不会被特殊处理(即它们将成为 ConfigMap 值的一部分)
# kubectl create configmap game-config-env-file --from-env-file=configMap/game-env-file.properties
apiVersion: v1
data:
allowed: '"true"' # 引号不会被特殊处理
enemies: aliens
lives: "3"
kind: ConfigMap
metadata:
creationTimestamp: "2025-05-06T11:31:12Z"
name: game-config-env-file
namespace: default
resourceVersion: "15746741"
uid: a01e6c70-2f32-4e3f-814b-72bbf45d79d2
|
1
2
3
4
5
6
7
8
9
10
11
12
13
14
15
16
| # 从 Kubernetes 1.23 版本开始 kubectl 支持多次指定 --from-env-file 参数来从多个数据源创建 ConfigMap
# kubectl create configmap config-multi-env-files --from-env-file=configMap/game-env-file.properties --from-env-file=configMap/ui-env-file.properties
data:
allowed: '"true"'
color: purple
enemies: aliens
how: fairlyNice
lives: "3"
textmode: "true"
kind: ConfigMap
metadata:
creationTimestamp: "2025-05-06T11:36:40Z"
name: config-multi-env-files
namespace: default
resourceVersion: "15747431"
uid: 194d9181-713a-4cc8-8218-ad4c5900f77b
|
定义从文件创建时要使用的键
1
| kubectl create configmap game-config-3 --from-file=<我的键名>=<文件路径>
|
根据字面值创建
1
2
3
4
5
6
7
8
9
10
11
12
13
14
| # 你可以将 kubectl create configmap 与 --from-literal 参数一起使用 通过命令行定义文字值
# 你可以传入多个键值对 命令行中提供的每对键值在 ConfigMap 的 data 部分中均表示为单独的条目
# kubectl create configmap special-config --from-literal=special.how=very --from-literal=special.type=charm
apiVersion: v1
data:
special.how: very
special.type: charm
kind: ConfigMap
metadata:
creationTimestamp: "2025-05-06T11:44:19Z"
name: special-config
namespace: default
resourceVersion: "15748397"
uid: 6952c791-32e6-4905-a45c-c6a1433779ff
|
在Pod中使用ConfigMap定义的环境变量
 1
 2
 3
 4
 5
 6
 7
 8
 9
10
11
12
13
14
15
16
17
18
19
20
21
22
23
24
25
26
27
28
29
30
31
32
33
34
35
36
37
38
39
| # configmap.yaml
apiVersion: v1
kind: ConfigMap
metadata:
name: special-config
namespace: default
data:
special.how: very
---
apiVersion: v1
kind: ConfigMap
metadata:
name: env-config
namespace: default
data:
log_level: INFO
# pod-configmap-env-variable.yaml
apiVersion: v1
kind: Pod
metadata:
name: dapi-test-pod
spec:
containers:
- name: test-container
image: ilolicon/demoapp:v1.0.0
command: [ "/bin/sh", "-c", "env" ]
env:
- name: SPECIAL_LEVEL_KEY
valueFrom:
configMapKeyRef:
name: special-config
key: special.how
- name: LOG_LEVEL
valueFrom:
configMapKeyRef:
name: env-config
key: log_level
restartPolicy: Never
|
将ConfigMap中的所有键值对配置为容器环境变量
 1
 2
 3
 4
 5
 6
 7
 8
 9
10
11
12
13
14
15
16
17
18
19
20
21
22
23
24
25
| # configmap.yaml
# 包含多个键值对
apiVersion: v1
kind: ConfigMap
metadata:
name: special-config
namespace: default
data:
SPECIAL_LEVEL: very
SPECIAL_TYPE: charm
# pod.yaml
apiVersion: v1
kind: Pod
metadata:
name: dapi-test-pod
spec:
containers:
- name: test-container
image: ilolicon/demoapp:v1.0.0
command: [ "/bin/sh", "-c", "env" ]
envFrom:
- configMapRef:
name: special-config
restartPolicy: Never
|
在Pod命令中使用ConfigMap定义的环境变量
 1
 2
 3
 4
 5
 6
 7
 8
 9
10
11
12
13
14
15
16
17
18
19
20
21
22
| # pod.yaml
apiVersion: v1
kind: Pod
metadata:
name: dapi-test-pod
spec:
containers:
- name: test-container
image: ilolicon/demoapp:v1.0.0
command: [ "/bin/echo", "$(SPECIAL_LEVEL_KEY) $(SPECIAL_TYPE_KEY)" ]
env:
- name: SPECIAL_LEVEL_KEY
valueFrom:
configMapKeyRef:
name: special-config
key: SPECIAL_LEVEL
- name: SPECIAL_TYPE_KEY
valueFrom:
configMapKeyRef:
name: special-config
key: SPECIAL_TYPE
restartPolicy: Never
|
将ConfigMap数据添加到一个卷中
1
2
3
4
5
6
7
8
9
10
11
12
13
14
15
16
17
18
19
20
| # pod.yaml
apiVersion: v1
kind: Pod
metadata:
name: dapi-test-pod
spec:
containers:
- name: test-container
image: ilolicon/demoapp:v1.0.0
command: [ "/bin/sh", "-c", "ls /etc/config/ && sleep 3600" ]
volumeMounts:
# 如果该容器镜像的 /etc/config 目录中有一些文件 卷挂载将使该镜像中的这些文件无法访问
- name: config-volume
mountPath: /etc/config
volumes:
- name: config-volume
configMap:
# 提供包含要添加到容器中的文件的 ConfigMap 的名称
name: special-config
restartPolicy: Never
|
热更新
- 当已挂载的 ConfigMap 被更新时 所投射的内容最终也会被更新 这适用于 Pod 启动后可选引用的 ConfigMap 重新出现的情况
- 更新 ConfigMap 目前并不会触发相关Pod的滚动更新(对于不能自动热更新的应用程序来说 则需要重新部署获取最新配置) 可以通过修改Pod的annotations 的方式强制触发滚动更新
kubectl patch deployment <your's deployment> --patch '{"spec":{"template":{"metadata":{"annotations":{"version/config":"6666666"}}}}}'
- 更新 ConfigMap 后
- 使用该ConfigMap挂载的Env不会同步更新
- 使用该ConfigMap挂载的volume中的数据需要一段时间才能同步更新
- 从ConfigMap更新到新键映射到Pod的总延迟可能与 kubelet 同步周期(默认为1分钟) + kubelet 中 ConfigMap 缓存的 TTL (默认为1分钟)一样长 你可以通过更新 Pod 的一个注解来触发立即刷新
 1
 2
 3
 4
 5
 6
 7
 8
 9
10
11
12
13
14
15
16
17
18
19
20
21
22
23
24
25
26
27
28
29
30
31
32
33
34
35
36
37
38
39
40
41
42
43
44
45
46
47
48
49
50
51
52
| # demoapp-configmap.yaml
# configmap更新后
# 1. 如果demoapp不支持自动更新配置 则需要重新重新触发滚动更新 重新触发方式:更新pod注解实现
# 2. 如果demoapp支持自动更新配置 则实时生效 无需重新发布应用
apiVersion: v1
data:
config.yaml: |
log_level: debug
kind: ConfigMap
metadata:
name: demoapp-config
# demoapp-hot-update-deployment.yaml
apiVersion: apps/v1
kind: Deployment
metadata:
labels:
app: demoapp-hot-update
name: demoapp-hot-update
spec:
replicas: 1
selector:
matchLabels:
app: demoapp-hot-update
template:
metadata:
labels:
app: demoapp-hot-update
spec:
containers:
- image: ilolicon/demoapp:v1.0.0
imagePullPolicy: Always
name: demoapp
volumeMounts:
- name: config-volume
mountPath: /opt/demoapp/
volumes:
- name: config-volume
configMap:
name: demoapp-config
---
apiVersion: v1
kind: Service
metadata:
name: demoapp-hot-update
spec:
selector:
app: demoapp-hot-update
ports:
- protocol: TCP
port: 80
targetPort: 80
|
不可改变
- 特性状态:
Kubernetes v1.21 [stable] - Kubernetes特性
Immutable Secret和ConfigMap提供了一种将各个Secret和ConfigMap设置为不可变更的选项 - 对于大量使用ConfigMap的集群(至少有数万个各不相同的ConfigMap给Pod挂载)而言 禁止更改ConfigMap的数据有以下好处
- 保护应用 使之免受意外(不想要的)更新所带来的负面影响
- 通过大幅降低对kube-apiserver的压力提升集群性能 这是因为系统会关闭对已标记为不可变更的ConfigMap的监视操作
- 你可以通过将
immutable字段设置为true创建不可变更的ConfigMap
1
2
3
4
5
6
7
| apiVersion: v1
kind: ConfigMap
metadata:
...
data:
...
immutable: true
|
- 一旦某ConfigMap被标记为不可变更 则无法逆转这一变化 也无法更改data或binaryData字段的内容
- 你只能删除并重建ConfigMap 因为现有的Pod会维护一个已被删除的ConfigMap的挂载点 建议重新创建这些Pods
限制
- 在
Pod规约中引用某个ConfigMap之前 必须先创建这个对象 或者在Pod规约中将ConfigMap标记为optional 如果所引用的ConfigMap不存在 并且没有将应用标记为optional 则Pod将无法启动 同样 引用ConfigMap中不存在的主键也会令Pod无法启动 除非你将Configmap标记为optional - 如果你使用
envFrom来基于ConfigMap定义环境变量 那么无效的键将被忽略 Pod可以被启动 但无效名称将被记录在事件日志中InvalidVariableNames 日志消息列出了每个被跳过的键
1
2
3
| # kubectl get events
LASTSEEN FIRSTSEEN COUNT NAME KIND SUBOBJECT TYPE REASON SOURCE MESSAGE
0s 0s 1 dapi-test-pod Pod Warning InvalidEnvironmentVariableNames {kubelet, 127.0.0.1} Keys [1badkey, 2alsobad] from the EnvFrom configMap default/myconfig were skipped since they are considered invalid environment variable names.
|
- ConfigMap位于确定的名字空间中 每个
ConfigMap只能被同一名字空间中的Pod引用 - 你不能将
ConfigMap用于静态Pod 因为Kubernetes不支持这种用法
Secret
- Secret是一种包含少量敏感信息例如密码、OAUTH令牌或SSH密钥的对象 这样的信息可能会被放在Pod规约中或者镜像中
- 使用Secret意味着你不需要在应用程序代码中包含机密数据
- Secret类似于ConfigMap但专门用于保存敏感数据
特性
- Kubernetes通过仅仅将Secret分发到需要访问Secret的Pod所在机器节点来保障其安全性
- Secret只会存储在几点的内存中 永不写入物理存储 这样从节点删除secret时就不需要擦除磁盘数据
- 从Kunernetes1.7版本开始 etcd会以加密形式存储Secret 一定程度的保证了Secret的安全性
类型
- 创建Secret时 你可以使用Secret资源的
type字段或者与其等价的kubectl命令行参数(如果有的话)为其设置类型 - Secret类型有助于对Secret数据进行编程处理
- Kubernetes提供若干种内置的类型 用于一些常见的使用场景 针对这些类型 Kubernetes所执行的合法性检查操作以及对其所实施的限制各不相同
| 内置类型 | 用法 |
|---|
| Opaque | 用户定义的任意数据 |
| kubernetes.io/service-account-token | 服务账号令牌 |
| kubernetes.io/dockercfg | ~/.dockercfg 文件的序列化形式 |
| kubernetes.io/dockerconfigjson | ~/.docker/config.json 文件的序列化形式 |
| kubernetes.io/basic-auth | 用于基本身份认证的凭据 |
| kubernetes.io/ssh-auth | 用于 SSH 身份认证的凭据 |
| kubernetes.io/tls | 用于 TLS 客户端或者服务器端的数据 |
| bootstrap.kubernetes.io/token | 启动引导令牌数据 |
Opaque
- 当你未在Secret清单中显式指定类型时 默认的Secret类型是Opaque
- 当你使用kubectl来创建一个Secret时 你必须使用generic子命令来标明要创建的是一个Opaque类型的Secret
1
2
3
4
5
6
7
| kubectl create secret generic empty-secret
kubectl get secret empty-secret
# 输出
# DATA列显示Secret中保存的数据条目个数 在这个例子中 0意味着你刚刚创建了一个空的Secret
NAME TYPE DATA AGE
empty-secret Opaque 0 22h
|
 1
 2
 3
 4
 5
 6
 7
 8
 9
10
11
12
13
14
15
16
17
18
19
20
21
22
23
24
25
26
| apiVersion: v1
kind: Secret
metadata:
name: mysecret
type: Opaque
data:
# 值经过base64编码
username: dXNlcm5hbWU=
password: cGFzc3dvcmQ=
# kubectl get secret mysecret -o yaml
apiVersion: v1
data:
password: cGFzc3dvcmQ=
username: dXNlcm5hbWU=
kind: Secret
metadata:
annotations:
kubectl.kubernetes.io/last-applied-configuration: |
{"apiVersion":"v1","data":{"password":"cGFzc3dvcmQ=","username":"dXNlcm5hbWU="},"kind":"Secret","metadata":{"annotations":{},"name":"mysecret","namespace":"default"}}
creationTimestamp: "2025-05-10T11:39:15Z"
name: mysecret
namespace: default
resourceVersion: "16477137"
uid: 6b70696f-dcd4-4b7d-a37e-8d1891b75077
type: Opaque
|
Pod中使用Secret的数据定义环境变量
- 如果容器已经使用了在环境变量中的Secret 除非容器重新启动 否则容器将无法感知到Secret的更新
- 有第三方解决方案可以在Secret改变时触发容器重启
1
2
3
4
5
6
7
8
9
10
11
12
13
14
15
16
17
18
19
20
21
22
23
24
25
| # pod.yaml
apiVersion: v1
kind: Pod
metadata:
name: envvars-multiple-secrets
spec:
containers:
- name: envars-test-container
image: ilolicon/demoapp:v1.0.0
env:
- name: APP_USERNAME
valueFrom:
secretKeyRef:
name: mysecret
key: username
- name: APP_PASSWORD
valueFrom:
secretKeyRef:
name: mysecret
key: password
# kubectl exec -it pods/envvars-multiple-secrets -- printenv | grep ^APP_
# 根据结果发现 secret使用时会自动解码
APP_USERNAME=username
APP_PASSWORD=password
|
Secret volume
 1
 2
 3
 4
 5
 6
 7
 8
 9
10
11
12
13
14
15
16
17
18
19
20
21
22
23
24
25
26
27
28
29
30
31
32
33
34
35
| apiVersion: v1
kind: Pod
metadata:
labels:
name: secret-volume
name: secret-volume-pod
spec:
volumes:
- name: volumes-secret
secret:
secretName: mysecret
containers:
- image: ilolicon/demoapp:v1.0.0
name: demoapp
volumeMounts:
- name: volumes-secret
mountPath: "/data"
# kubectl exec -it pods/secret-volume-pod -- cat -n /data/{username,password}
# /data 下面有2个文件 username和password
1 username
2 password
# 挂载指定key及指定目录
spec:
volumes:
- name: volumes-secret
secret:
secretName: mysecret
items: # 未做软连接 无法热更新
- key: username
path: my-group/my-username
# 进容器查看内容 cat /data/my-group/my-username
username
|
为Secret键设置POSIX权限
1
2
3
4
5
6
| spec:
volumes:
- name: volumes-secret
secret:
secretName: mysecret
defaultMode: 0644
|
- 说明
- 如果使用JSON定义Pod或Pod模板 请注意JSON规范不支持数字的八进制形式
- 因为JSON将0400视为十进制的值400 在JSON中 要改为使用十进制的defaultMode
- 如果你正在编写YAML 则可以用八进制编写defaultMode
热更新
- ENV/挂载子路径 都不能自动更新
- 除非容器重启 第三方方案可以监视Secret改变时 自动触发容器重启
- 当卷中包含来自Secret的数据 而对应的Secret被更新 Kubernetes会跟踪到这一操作并更新卷中的数据 更新的方式是保证最终一致性
不可改变
- 特性状态:
Kubernetes v1.21 [stable] - Kubernetes允许你将特定的Secret(和ConfigMap)标记为不可更改
Immutable 禁止更改现有Secret的数据有下列好处- 防止意外(或非预期的)更新导致应用程序中断
- (对于大量使用Secret的集群而言 至少数万个不同的Secret供Pod挂载) 通过将Secret标记为不可变 可以极大降低kube-apiserver的负载 提升集群性能 kubelet不需要监视那些被标记为不可更改的Secret
1
2
3
4
5
6
7
8
| # 你也可以更改现有的Secret 令其不可更改
apiVersion: v1
kind: Secret
metadata:
...
data:
...
immutable: true
|
downwardAPI
downwardAPI卷用于为应用提供downwardAPI数据 在这类卷中 所公开的数据以纯文本格式的只读文件形式存在- downwardAPI数据: 将Pod和容器字段值暴露给容器中运行的代码的机制
- downwardAPI是kubernetes中的一个功能 它允许容器在运行时从kubernetesAPI服务器获取有关它们自身的信息
- 这些信息可以作为容器内部的环境变量或文件注入到容器中 以便容器可以获取有关其运行环境的各种信息 如Pod名称/命名空间/标签等
- 提供容器元数据
- 动态配置
- 与Kubernetes环境集成
- 也可以注入env 或使用volume挂载
扩展
- downwardAPI提供了一种简单的方式 将pod和容器的元数据传递给它们内部运行的进程
- 但这种方式其实仅仅可以暴露一个pod自身的元数据传递给在它们内部运行的进程
- 这种方式仅仅可以暴露一个pod自身的元数据 而且只可以暴露部分元数据
- 还有另一种方式 从API服务器获取

1
2
3
4
5
6
7
8
9
10
11
12
13
| # kubectl proxy --port=8080
# 获取swagger-ui配置
curl http://127.0.0.1:8080/openapi/v2 > k8s-swagger.json
# 粘贴至swagger在线UI
https://editor.swagger.io/
# 或run本地swagger-ui服务器
docker run --rm -d -p 80:8080 \
-e SWAGGER_JSON=/k8s-swagger.json \
-v $(pwd)/k8s-swagger.json \
swaggerapi/swagger-ui
|
Volume
- 数据的持久化方案
- 容器磁盘上的文件的生命周期是短暂的 这就使得在容器中运行重要应用时会出现一些问题
- 首先 当容器崩溃时 kubelet会重启它 但是容器中的文件将丢失 容器以干净的状态(镜像最初的状态)重新启动
- 其次 在Pod中同时运行多个容器时 这些容器之间通常需要共享文件
- Kubernetes中的
Volume抽象 就很好的解决了这些问题 部分最新版已启用 参考最新官方文档描述- awsElasticBlockStore
- azureDisk
- cephfs
- configMap
- downwardAPI
- emptyDir
- gitRepo
- glusterfs
- hostPath
- nfs
- persistentVolumeClaim
- secret
- …
emptyDir
- 对于定义了emptyDir卷的Pod 在Pod被指派到某节点时此卷会被创建
- 就像其名称所表示的那样emptyDir卷最初是空的
- 尽管Pod中的容器挂载emptyDir卷的路径可能相同也可能不同 但这些容器都可以读写emptyDir卷中相同的文件
- 当Pod因为某些原因被从节点上删除时 emptyDir卷中的数据也会被永久删除
说明:
容器崩溃并不会导致Pod被从节点上移除 因此容器崩溃期间emptyDir卷中的数据是安全的
- emptyDir的一些用途:
- 缓存空间 例如基于磁盘的归并排序
- 为耗时较长的计算任务提供检查点 以便任务能方便地从崩溃前状态恢复执行
- 在Web服务器容器服务数据时 保存内容管理器容器获取的文件
hostPath
hostPath卷能将主机节点文件系统上的文件或目录挂载到你的Pod中 虽然这不是大多数Pod需要的 但是它为一些应用提供了强大的逃生舱- 用途
- 运行一个需要访问节点级系统组件的容器
- 运行需要你访问Docker内部的容器 使用
/var/lib/docker的hostPath - 在容器中运行cAdvisor 使用
/dev/cgroups的hostPath - 例如一个将系统日志传输到集中位置的容器 使用只读挂载
/var/log来访问这些日志
- 让存储在主机系统上的配置文件可以被静态Pod以只读方式访问 与普通Pod不同 静态Pod无法访问ConfigMap
- 静态Pod(Static Pod): 是由特定节点上的kubelet守护进程直接管理的Pod(/etc/kubernetes/manifests)
- 它并不经过常规的 APIServer -> ControllerManager -> kubelet的控制链路
警告:
使用hostPath类型的卷存在许多安全风险 如果可以 你应该尽量避免使用hostPath卷 例如 你可以改为定义并使用 local PersistentVolume
如果你通过准入时的验证来限制对节点上特定目录的访问 这种限制只有在你额外要求所有hostPath卷的挂载都是只读的情况下才有效 如果你允许不受信任的Pod以读写方式挂载任意主机路径 则该Pod中的容器可能会破坏可读写主机挂载卷的安全性
无论hostPath卷是以只读还是读写方式挂载 使用时都需要小心 这是因为:
- 访问主机文件系统可能会暴露特权系统凭证(例如kubelet的凭证)或特权API(例如容器运行时套接字) 这些可以被用于容器逃逸或攻击集群的其他部分
- 具有相同配置的Pod(例如基于PodTemplate创建的Pod)可能会由于节点上的文件不同而在不同节点上表现出不同的行为
hostPath卷的用量不会被视为临时存储用量 你需要自己监控磁盘使用情况 因为过多的hostPath磁盘使用量会导致节点上的磁盘压力
hostPath卷类型
| 取值 | 行为 |
|---|
| "" | 空字符串(默认)用于向后兼容 这意味着在安装hostPath卷之前不会执行任何检查 |
| DirectoryOrCreate | 如果在给定路径上什么都不存在 那么将根据需要创建空目录 权限设置为0755 具有与kubelet相同的组和属主信息 |
| Directory | 在给定路径上必须存在的目录 |
| FileOrCreate | 如果在给定路径上什么都不存在 那么将在那里根据需要创建空文件 权限设置为0644 具有与kubelet相同的组和所有权 |
| File | 在给定路径上必须存在的文件 |
| Socket | 在给定路径上必须存在的UNIX套接字 |
| CharDevice | (仅Linux节点) 在给定路径上必须存在的字符设备 |
| BlockDevice | (仅Linux节点) 在给定路径上必须存在的块设备 |
注意
FileOrCreate模式不会创建文件的父目录 如果挂载文件的父目录不存在 Pod将启动失败 为了确保这种模式正常工作 你可以尝试分别挂载目录和文件- 当Kubernetes按照计划添加资源感知调度时 将无法考虑
hostPath使用的资源 - 底层主机上创建的某些文件或目录只能由
root用户访问 此时 你需要在特权容器中以root身份运行进程 或者修改主机上的文件权限 以便能够从hostPath卷读取数据(或将数据写入到hostPath卷)
PV/PVC
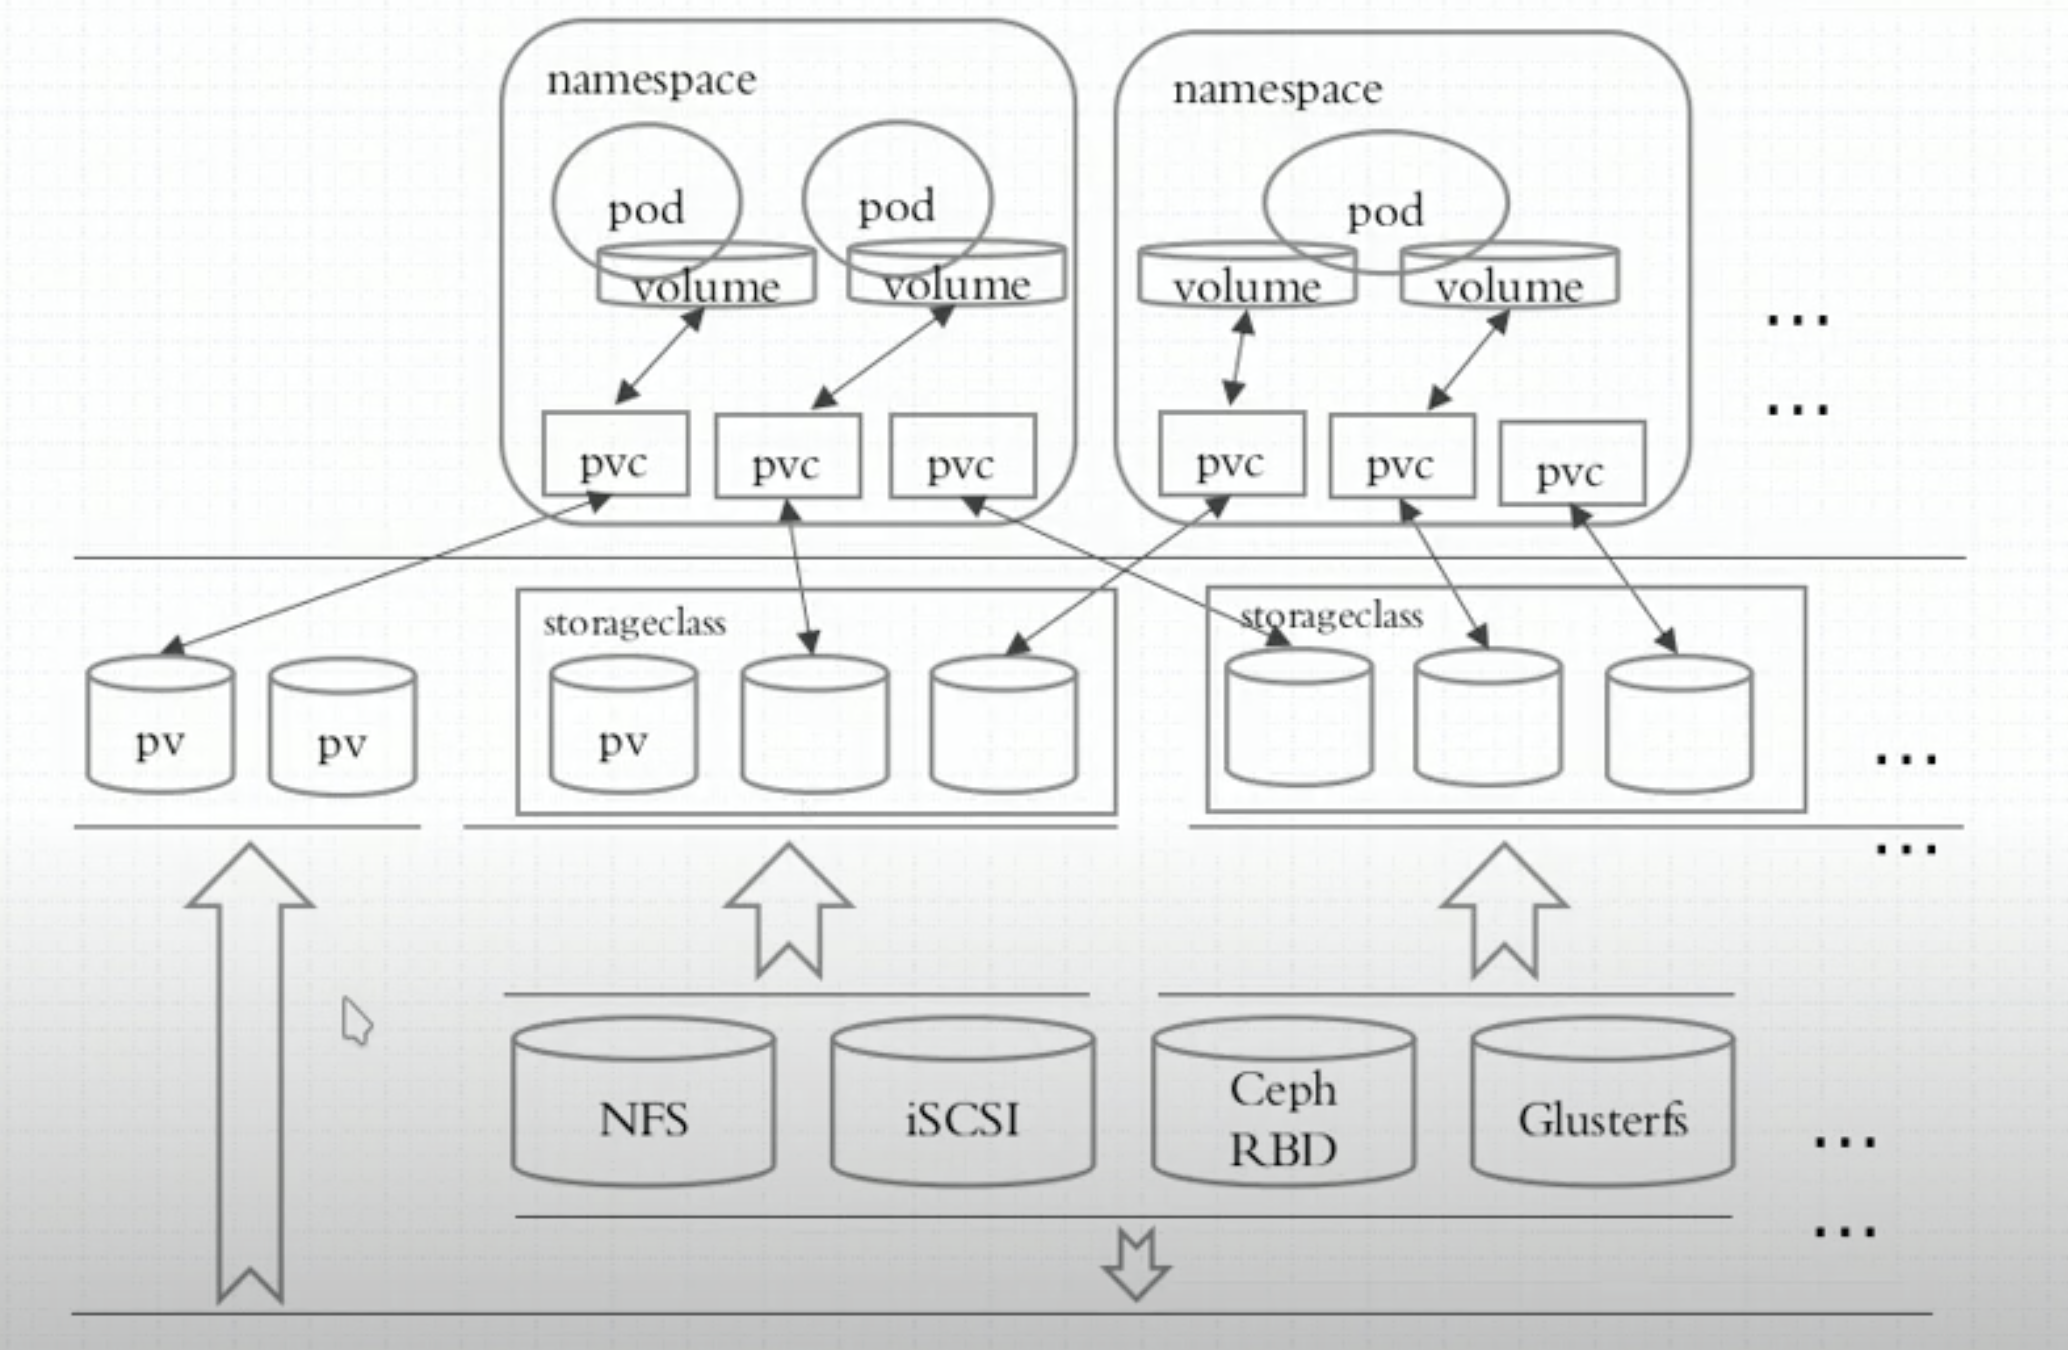
- 存储的管理是一个与计算实例的管理完全不同的问题 PersistentVolume子系统为用户和管理员提供了一组API 将存储如何制备的细节从其如何被使用中抽象出来
- 为了实现这点 Kubernetes引入了两个心的API资源
- PersistentVolume
- PersistentVolumeClaim
- 持久卷(PersistentVolume PV)
- 是集群中的一块存储 可以由管理员事先制备 或者使用存储类(Storage Class)来动态制备
- 持久卷是集群级别的资源 就像节点也是集群资源一样
- PV持久卷和普通的Volume一样 也是使用卷插件来实现的 只是它们拥有独立于任何使用PV的Pod的生命周期
- 此API对象中记述了存储的实现细节 无论其背后是NFS、iSCSI还是特定于云平台的存储系统
- 持久卷声明(PersistentVolumeClaim PVC)
- 表达的是用户对存储的请求 概念上与Pod类似
- Pod会耗用节点资源 而PVC申领会耗用PV资源
- Pod可以请求特定数量的资源(CPU和内存) 同样PVC申领也可以请求特定的大小和访问模式
- 例如 可以挂载为ReadWriteOnce、ReadOnlyMany、ReadWriteMany或ReadWriteOncePod
关联条件
- 容量: PV的值不小于PVC要求 可以大于 最好一致
- 读写策略(访问模式):完全匹配
- 单节点读写:ReadWriteOnce / RWO
- 多节点只读:ReadOnlyMany / ROX
- 多节点读写:ReadWriteMany / RWX
- ReadWriteOncePod / RWOP: v1.29[stable]
- 卷可以被单个Pod以读写方式挂载
- 如果你想确保整个集群中只有一个Pod可以读取或写入该PVC 使用该方式
- 存储类:PV的类与PVC的类必须一致 不存在包容降级关系
回收策略(Reclaiming)
- 当用户不再使用其存储卷时 他们可以从API中将PVC对象删除 从而允许该资源被回收再利用
- PersistentVolume对象的回收策略告诉集群 当其被从申领中释放时如何处理该数据卷
- 目前 数据卷可以被Retained(保留) Recycled(回收) Deleted(删除)
保留(Retain)
- 回收策略
Retain使得用户可以手动回收资源 - 当PersistentVolumeClaim对象被删除时 PersistentVolume卷仍然存在 对应的数据卷被视为"已释放(released)"
- 由于卷上仍然存在这前一申领人的数据 该卷还不能用于其他申领 管理员可以通过下面的步骤来手动回收该卷:
- 删除PersistentVolume对象 与之相关的、位于外部基础设施中的存储资产在PV删除之后仍然存在
- 根据情况 手动清除所关联的存储资产上的数据
- 手动删除所关联的存储资产
- 如果你希望重用该存储资产 可以基于存储资产的定义创建新的PersistentVolume卷对象
删除(Delete)
- 对于支持
Delete回收策略的卷插件 删除动作会将PersistentVolume对象从Kubernetes中移除 同时也会从外部基础设施中移除所关联的存储资产 - 动态制备的卷会继承其StorageClass中设置的回收策略 该策略默认为Delete
- 管理员需要根据用户的期望来配置StorageClass 否则PV卷被创建之后必须要被编辑或者修补 参阅更改PV卷的回收策略
回收(Recyle)
- 警告: 回收策略
Recycle已被废弃 取而代之的建议方案是使用动态制备 - 如果底层的卷插件支持 回收策略
Recycle会在卷上执行一些基本的擦除(rm -rf /thevolume/*)操作 之后允许该卷用于新PVC申领
卷阶段(状态)
每个持久卷会处于以下阶段(Phase)之一:
- Available 卷是一个空闲资源 尚未绑定到任何申领
- Bound 该卷已经绑定到某申领
- Released 所绑定的申领已被删除 但是关联存储资源尚未被集群回收
- Failed 卷的自动回收操作失败
你可以使用kubectl describe persistentvolume <name>查看已绑定到PV的PVC的名称
PVC保护
- PVC保护的目的是确保由Pod正在使用的PVC不会从系统中移除 因为如果被移除的话可能导致数据丢失
- 注意:当Pod状态为
Pending并且Pod已经分配给节点 或Pod为Running状态时 PVC处于活动状态 - 当启用PVC保护功能时 如果用户删除了一个Pod正在使用的PVC 则该PVC不会被立即删除 PVC的删除将被推迟 直到PVC不再被任何的Pod使用
示例
配置Pod以使用PersistentVolume作为存储
StorageClass
1
2
3
4
5
6
7
8
9
| apt-get upate
apt install -y nfs-kernerl-server
mkdir /nfs/data
chown nobody -R /nfs
/etc/exports
/nfs/data *(rw,sync,no_subtree_check)
systemctl restart nfs-server
showmount -e 192.168.56.75
|
 1
 2
 3
 4
 5
 6
 7
 8
 9
10
11
12
13
14
15
16
17
18
19
20
21
22
23
24
25
26
27
28
29
30
31
32
33
34
35
36
37
38
39
40
41
42
43
44
45
46
47
48
49
50
51
52
53
54
55
56
57
58
59
60
61
62
63
64
65
66
67
68
69
70
71
72
73
74
75
76
77
78
79
80
81
82
83
84
85
86
87
88
89
90
91
92
93
94
95
96
97
98
99
100
101
102
103
104
105
106
107
108
109
110
111
112
113
114
115
116
| kind: Deployment
apiVersion: apps/v1
metadata:
name: nfs-client-provisioner
namespace: nfs-storageclass
spec:
replicas: 1
selector:
matchLabels:
app: nfs-client-provisioner
strategy:
type: Recreate
template:
metadata:
labels:
app: nfs-client-provisioner
spec:
serviceAccountName: nfs-client-provisioner
containers:
- name: nfs-client-provisioner
image: eipwork/nfs-subdir-external-provisioner:v4.0.2
volumeMounts:
- name: nfs-client-root
mountPath: /persistentvolumes
env:
- name: PROVISIONER_NAME
value: k8s-sigs.io/nfs-subdir-external-provisioner
- name: NFS_SERVER
value: 192.168.56.75
- name: NFS_PATH
value: /nfs/data
volumes:
- name: nfs-client-root
nfs:
# server: <YOUR NFS SERVER HOSTNAME>
server: 192.168.56.75
# share nfs path
path: /nfs/data
---
apiVersion: v1
kind: ServiceAccount
metadata:
name: nfs-client-provisioner
namespace: nfs-storageclass
---
kind: ClusterRole
apiVersion: rbac.authorization.k8s.io/v1
metadata:
name: nfs-client-provisioner-runner
rules:
- apiGroups: ['']
resources: ['nodes']
verbs: ['get', 'list', 'watch']
- apiGroups: ['']
resources: ['persistentvolumes']
verbs: ['get', 'list', 'watch', 'create', 'delete']
- apiGroups: ['']
resources: ['persistentvolumeclaims']
verbs: ['get', 'list', 'watch', 'update']
- apiGroups: ['storage.k8s.io']
resources: ['storageclasses']
verbs: ['get', 'list', 'watch']
- apiGroups: ['']
resources: ['events']
verbs: ['create', 'update', 'patch']
---
kind: ClusterRoleBinding
apiVersion: rbac.authorization.k8s.io/v1
metadata:
name: run-nfs-client-provisioner
subjects:
- kind: ServiceAccount
name: nfs-client-provisioner
# replace with namespace where provisioner is deployed
namespace: nfs-storageclass
roleRef:
kind: ClusterRole
name: nfs-client-provisioner-runner
apiGroup: rbac.authorization.k8s.io
---
kind: Role
apiVersion: rbac.authorization.k8s.io/v1
metadata:
name: leader-locking-nfs-client-provisioner
# replace with namespace where provisioner is deployed
namespace: nfs-storageclass
rules:
- apiGroups: ['']
resources: ['endpoints']
verbs: ['get', 'list', 'watch', 'create', 'update', 'patch']
---
kind: RoleBinding
apiVersion: rbac.authorization.k8s.io/v1
metadata:
name: leader-locking-nfs-client-provisioner
# replace with namespace where provisioner is deployed
namespace: nfs-storageclass
subjects:
- kind: ServiceAccount
name: nfs-client-provisioner
# replace with namespace where provisioner is deployed
namespace: nfs-storageclass
roleRef:
kind: Role
name: leader-locking-nfs-client-provisioner
apiGroup: rbac.authorization.k8s.io
---
apiVersion: storage.k8s.io/v1
kind: StorageClass
metadata:
name: nfs-client
namespace: nfs-storageclass
provisioner: k8s-sigs.io/nfs-subdir-external-provisioner
parameters:
pathPattern: ${.PVC.namespace}/${.PVC.name}
onDelete: delete
|
 1
 2
 3
 4
 5
 6
 7
 8
 9
10
11
12
13
14
15
16
17
18
19
20
21
22
23
24
25
26
27
28
29
| # test-pod.yaml
kind: PersistentVolumeClaim
apiVersion: v1
metadata:
name: test-claim
spec:
accessModes:
- ReadWriteMany
resources:
requests:
storage: 1Mi
storageClassName: nfs-client
---
kind: Pod
apiVersion: v1
metadata:
name: test-pod
spec:
containers:
- name: test-pod
image: ilolicon/demoapp:v1.0.0
volumeMounts:
- name: nfs-pvc
mountPath: /opt/demoapp/nfsdata
restartPolicy: 'Never'
volumes:
- name: nfs-pvc
persistentVolumeClaim:
claimName: test-claim
|
StatefulSet控制器
CoreOS Operator
cattle/pet # 一个关注群体 一个关注个体(和无状态应用的区别)
PetSet(1.3) -> StatefulSet(1.5+)
StatefulSet主要用于管理有以下特性的应用程序
- 稳定且唯一的网络标识符
- 稳定且持久的存储
- 有序、平滑的部署和扩展
- 有序、平滑的终止和删除
- 有序的滚动更新
一般来说 一个典型的StatefulSet由三个组件组成
- handless service # 无头服务 确保名称唯一
- StatefulSet # 控制器
- volumeClaimTemplate # 存储卷申请模版(不能使用同一存储卷 pod模版创建的存储卷都是一样的 所以需要卷申请模版)
kubelet explain sts.spec.updateStrategy.rollingUpdate
- partition <inter> # 控制更新的Pod
- partition: N # 大于等于编号N的Pod将被更新 默认值: 0
示例
 1
 2
 3
 4
 5
 6
 7
 8
 9
10
11
12
13
14
15
16
17
18
19
20
21
22
23
24
25
26
27
28
29
30
31
32
33
34
35
36
37
38
39
40
41
42
43
44
45
46
47
48
49
50
51
52
53
54
55
56
57
58
59
60
61
62
63
64
65
| # 创建PV
apiVersion: v1
kind: PersistentVolume
metadata:
name: nfspv1
spec:
capacity:
storage: 1Gi
accessModes:
- ReadWriteOnce
persistentVolumeReclaimPolicy: Recycle
storageClassName: nfs
nfs:
path: /nfs/pv1
server: 192.168.56.75
# statefulset
apiVersion: v1
kind: Service
metadata:
name: myapp
labels:
app: myapp
spec:
ports:
- port: 80
name: web
# 无头服务 访问: <podName>.<svcName>.default.svc.cluster.local 可访问到具体pod地址
clusterIP: None
selector:
app: myapp
---
apiVersion: apps/v1
kind: StatefulSet
metadata:
name: web
spec:
selector:
matchLabels:
app: myapp
serviceName: myapp # kubectl explain statefulsets.apps.spec.serviceName
replicas: 3
template:
metadata:
labels:
app: myapp
spec:
containers:
- name: myapp
image: ilolicon/demoapp:v1.0.0
ports:
- containerPort: 80
name: web
volumeMounts:
- name: config
mountPath: /opt/demoapp/
volumeClaimTemplates:
- metadata:
name: config
spec:
accessModes: ["ReadWriteOnce"]
storageClassName: "nfs"
resources:
requests:
storage: 1Gi
|
调度器
概念
kubernetes调度器
Pod QoS类
为Pod和容器管理资源
- kube-scheduler是kubernetes的调度器 主要任务是把定义的Pod分配到集群的节点上

- scheduler是作为单独的程序运行的 启动之后会一致监听API Server 获取
PodSpec.NodeName为空的pod 对每个Pod都会创建一个binding 表明该pod应该放到哪个节点上 - 需要考虑的问题
- 公平:如何保证每个节点都能被分配资源
- 资源高效利用:集群所有资源最大化被使用
- 效率:调度的性能要好 能够尽快地对大批量的pod完成调度工作
- 灵活:允许用户根据自己的需求控制调度的逻辑
- 除来kuberneres自带的调度器 你也可以编写自己的调度器 通过
spec.schedulerName参数指定调度器的名字 可以为pod选择某个调度器进行调度
自定义调度器示例
1
2
3
4
5
6
7
8
9
10
11
| apiVersion: v1
kind: Pod
metadata:
name: demoapp
labels:
name: demoapp
spec:
schedulerName: my-scheduler # 指定自定义调度器
containers:
- name: pod-with-custom-scheduler
iamge: ilolicon/demoapp:v1.0.0
|
1
2
3
4
5
6
7
8
9
10
11
12
13
14
15
16
17
18
19
20
21
22
23
24
25
| # 在 kubernetes Master 节点开启 apiServer 的代理
kubectl proxy --port=8001
#!/bin/bash
# my-scheduler.sh
SERVER='localhost:8001'
while true;
do
for PODNAME in $(kubectl --server $SERVER get pods -o json | jq '.items[] |
select(.spec.schedulerName =="my-scheduler") | select(.spec.nodeName == null) |
.metadata.name' | tr -d '"')
do
NODES=($(kubectl --server $SERVER get nodes -o json | jq
'.items[].metadata.name' | tr -d '"'))
NUMNODES=${#NODES[@]}
CHOSEN=${NODES[$[ $RANDOM % $NUMNODES]]}
curl --header "Content-Type:application/json" --request POST --data
'{"apiVersion":"v1","kind":"Binding","metadata": {"name":"'$PODNAME'"},"target":
{"apiVersion":"v1","kind": "Node", "name": "'$CHOSEN'"}}'
http://$SERVER/api/v1/namespaces/default/pods/$PODNAME/binding/
echo "Assigned $PODNAME to $CHOSEN"
done
sleep 1
done
|
调度过程
- 调度器分为几个部分
- 首先是过滤掉不满足条件的节点 这个过程称为预选(过滤)
- 然后通过对节点按照优先级排序 这个是优选(打分)
- 最后从中选择优先级最高的节点 如果中间任何一步骤有错误 就直接返回错误
- 预选
- PodFitsResources: 节点上剩余的资源是否大于pod请求的资源
- PodFitsHost: 如果pod指定来NodeName 检查节点名称是否和NodeName匹配
- PodFitsHostPorts: 节点上已经使用的port是否和pod申请的port冲突
- PodSelectorMatches: 过滤掉和pod指定的label不匹配的节点
- NoDiskConflict: 已经mount的volume和pod指定的volume不冲突 除非它们都是只读
- 优选
- 如果在
预选过程中没有合适的节点 pod会一直在pending状态 不断重试调度 直到有节点满足条件 - 经过这个步骤 如果有多个节点满足条件 就继续
优先过程 按照优先级大小对节点排序 - 优先级由一系列键值对组成 键是该优先级项的名称 值是它的权重 这先优先级选项包括
- LeastRequestedPriority: 通过计算CPU和Memory的使用率来决定权重 使用率越低权重越高 换句话说 这个优先级指标倾向于资源使用比例更低的节点
- BalancedResourceAllocation: 节点上CPU和Memory使用率越接近 权重越高 这个应该和上面的一起使用 不应该单独使用
- ImageLocalityPriority: 倾向于已经有要使用镜像的节点 镜像总大小值越大 权重越高
亲和性
节点亲和性
- 节点亲和性概念上类似于
nodeSelector 它使你可以根据节点上的标签来约束Pod可以调度到哪些节点上 节点亲和性有两种requiredDuringSchedulingIgnoredDuringExecution:调度器只有在规则被满足的时候才能执行调度 此功能类似于nodeSelector 但其语法表达能力更强preferredDuringSchedulingIgnoredDuringExecution:调度器会尝试寻找满足对应规则的节点 如果找不到匹配的节点 调度器仍然会调度该Pod
说明:在上述类型中 IgnoredDuringExecution意味着如果节点标签在Kubernetes调度Pod后发生了变更 Pod 仍将继续运行
1
2
3
4
5
6
7
8
9
10
11
12
13
14
15
16
17
18
19
20
21
22
23
24
25
26
| apiVersion: v1
kind: Pod
metadata:
name: with-node-affinity
spec:
affinity:
nodeAffinity:
requiredDuringSchedulingIgnoredDuringExecution:
nodeSelectorTerms:
- matchExpressions:
- key: topology.kubernetes.io/zone
operator: In
values:
- antarctica-east1
- antarctica-west1
preferredDuringSchedulingIgnoredDuringExecution:
- weight: 1
preference:
matchExpressions:
- key: another-node-label-key
operator: In
values:
- another-node-label-value
containers:
- name: with-node-affinity
image: registry.k8s.io/pause:2.0
|
- 上述示例含义:
- 节点必须包含一个键名为
topology.kubernetes.io/zone的标签 并且该标签的取值必须为 antarctica-east1 或 antarctica-west1 - 节点最好具有一个键名为
another-node-label-key且取值为another-node-label-value的标签
operator字段操作符- In
- NotIn
- Exists
- DoesNotExist
- Gt
- Lt
NotIn和DoesNotExist可用来实现节点反亲和性行为 你也可以使用节点污点将Pod从特定节点驱逐
Pod间亲和性与反亲和性
- Pod间亲和性与反亲和性使你可以基于已经在节点上运行的Pod的标签来约束Pod可以调度到的节点 而不是基于节点上的标签
- Pod间亲和性与反亲和性的规则格式为"如果X上已经运行了一个或多个满足规则Y的Pod 则这个Pod应该(或者在反亲和性的情况下不应该)运行在X上"
- 这里的X可以是节点、机架、云提供商可用区或地理区域或类似的拓扑域
- Y则是Kubernetes尝试满足的规则
- 你通过标签选择算符的形式来表达规则(Y) 并可根据需要指定选关联的名字空间列表 Pod在Kubernetes中是名字空间作用域的对象 因此Pod的标签也隐式地具有名字空间属性 针对Pod标签的所有标签选择算符都要指定名字空间 Kubernetes会在指定的名字空间内寻找标签
- 你会通过
topologyKey来表达拓扑域(X)的概念 其取值是系统用来标示域的节点标签键 相关示例可参见常用标签、注解和污点
说明:
Pod间亲和性和反亲和性都需要相当的计算量 因此会在大规模集群中显著降低调度速度 我们不建议在包含数百个节点的集群中使用这类设置
说明:
Pod反亲和性需要节点上存在一致性的标签 换言之 集群中每个节点都必须拥有与topologyKey匹配的标签 如果某些或者所有节点上不存在所指定的topologyKey标签 调度行为可能与预期的不同
总结
| 调度策略 | 匹配标签 | 操作符 | 拓扑域支持 | 调度目标 |
|---|
| nodeAffinity | 主机 | In/NotIn/Exists/DoesNotExist/Gt/Lt | 否 | 指定主机 |
| podAffinity | POD | In/NotIn/Exists/DoesNotExist | 是 | POD与指定POD同一拓扑域 |
| podAnitAffinity | POD | In/NotIn/Exists/DoesNotExist | 是 | POD与指定POD不在同一拓扑域 |
容忍与污点
- 节点亲和性是Pod的一种属性 它使Pod被吸引到一类特定的节点(这可能出于一种偏好 也可能是硬性要求) **污点(Taint)**则相反——它使节点能够排斥一类特定的Pod
- 容忍度Toleration 是应用于Pod上的 容忍度允许调度器调度带有对应污点的Pod 容忍度允许调度但并不保证调度:作为其功能的一部分 调度器也会评估其他参数
- 污点和容忍度(Toleration)相互配合 可以用来避免Pod被分配到不合适的节点上 每个节点上都可以应用一个或多个污点 这表示对于那些不能容忍这些污点的Pod 是不会被该节点接受的
组成
key=value:effect
- 每个污点有一个key和value作为污点的标签 其中value可以为空 effect描述污点的作用
- 当前的taint effect支持如下三个选项
- NoSchedule: 表示k8s将不会将Pod调度到具有该污点的Node上
- PreferNoSchedule: 表示k8s将尽量避免将Pod调度到具有该污点的Node上
- NoExecute: 表示k8s将不会将Pod调度到具有该污点的Node上 同时会将Node上已经存在的Pod驱逐出去
设置和去除
1
2
3
4
5
6
7
8
| # 给节点增加一个污点
kubectl taint nodes node1 key1=value1:NoSchedule
# 节点说明中 查找Taints字段
kubectl describe pod pod-name
# 移除上述污点
kubectl taint nodes node1 key1=value1:NoSchedule-
|
容忍
- 设置里污点的Node 将根据taint的effect:
NoSchedule PreferNoSchedule NoExecute和Pod之间产生互斥的关系 Pod将在一定程度上不会被调度到Node上 - 但我们可以在Pod上设置容忍(Toleration) 意思是设置里容忍的Pod将可以容忍污点的存在 可以被调度到存在污点的Node上
容忍设置方式
1
2
3
4
5
6
7
8
9
10
11
12
13
14
15
16
17
18
| tolerations:
- key: "key1"
operator: "Equal"
value: "value1"
effect: "NoSchedule"
---
tolerations:
- key: "key1"
operator: "Equal"
value: "value1"
effect: "NoExecute"
tolerationSeconds: 3600
# tolerationSeconds: 这表示如果这个Pod正在运行 同时一个匹配的污点被添加到其所在的节点
# 那么Pod还将继续在节点上运行3600秒 然后被驱逐
# 如果在此之前上述污点被删除了 则Pod不会被驱逐
|
容忍的特殊类型
operator的默认是Equal- 一个容忍度和一个污点相匹配是指它们有一样的键名和效果 并且
- 如果
operator是Exists 此时容忍度不能指定value 或者 - 如果
operator是Equal 则它们的值应该相等
特殊类型
- 当不指定value时 表示容忍所有的污点value
1
2
3
| - key: "key2"
operator: "Exists"
effect: "NoSchedule"
|
1
2
| tolerations:
- operator: "Exists"
|
1
2
3
| tolerations:
- key: "key"
operator: "Exists"
|
- 有多个master存在时 防止资源浪费 可以如下设置
1
| kubectl taint nodes Node-Name node-role.kubernetes.io/master=:PreferNoSchedule
|
基于污点的驱逐
- 当某种条件为真时 节点控制器会自动给节点添加一个污点 当前内置的污点包括:
node.kubernetes.io/not-ready:节点未准备好 这相当于节点状况Ready的值为"False"node.kubernetes.io/unreachable:节点控制器访问不到节点 这相当于节点状况Ready的值为 “Unknown”node.kubernetes.io/memory-pressure:节点存在内存压力node.kubernetes.io/disk-pressure:节点存在磁盘压力node.kubernetes.io/pid-pressure:节点的PID压力node.kubernetes.io/network-unavailable:节点网络不可用node.kubernetes.io/unschedulable:节点不可调度node.cloudprovider.kubernetes.io/uninitialized:如果kubelet启动时指定了一个"外部"云平台驱动 它将给当前节点添加一个污点将其标志为不可用 在cloud-controller-manager的一个控制器初始化这个节点后 kubelet将删除这个污点
- 在节点被排空时 节点控制器或者kubelet会添加带有
NoExecute效果的相关污点 此效果被默认添加到node.kubernetes.io/not-ready和node.kubernetes.io/unreachable污点中 如果异常状态恢复正常 kubelet或节点控制器能够移除相关的污点 - 在某些情况下 当节点不可达时 API服务器无法与节点上的
kubelet进行通信 在与API服务器的通信被重新建立之前 删除Pod的决定无法传递到kubelet 同时 被调度进行删除的那些Pod可能会继续运行在分区后的节点上
固定节点调度
指定节点调度
pod.spec.nodeName将Pod直接调度到指定的Node节点上 会跳过Scheduler的调度策略 该匹配规则时强制匹配- 如果
nodeName字段不为空 调度器会忽略该Pod 而指定节点上的kubelet会尝试将Pod放到该节点上 - 使用
nodeName规则的优先级会高于使用nodeSelector或亲和性与非亲和性的规则 - 局限性
- 如果所指代的节点不存在 则Pod无法运行 而且在某些情况下可能会被自动删除
- 如果所指代的节点无法提供用来运行Pod所需的资源 Pod会失败 而其失败原因中会给出是否因为内存或CPU不足而造成无法运行
- 在云环境中的节点名称并不总是可预测的 也不总是稳定的
1
2
3
4
5
6
7
8
9
| apiVersion: v1
kind: Pod
metadata:
name: nginx
spec:
containers:
- name: nginx
image: nginx
nodeName: kube-01 # 该Pod只能运行在节点kube-01上
|
指定节点标签调度
将Pod分配给节点
标签和选择运算符
po.spec.nodeSelector通过kubernetes的label-selector机制选择节点 由调度器策略匹配label 而后调度Pod到目标节点 该匹配规则属于强制约束
1
2
3
4
5
6
7
8
| # 列出集群节点及标签
kubectl get nodes --show-labels
# 给节点添加标签
kubectl label nodes <node-name> disktype=ssd
# 查找对应标签node
kubectl get nodes -l disktype=ssd
|
1
2
3
4
5
6
7
8
9
10
11
12
13
| apiVersion: v1
kind: Pod
metadata:
name: nginx
labels:
env: test
spec:
containers:
- name: nginx
image: nginx
imagePullPolicy: IfNotPresent
nodeSelector: # 该Pod会调度到具有下面标签的节点上
disktype: ssd
|
认证及ServiceAccount
认证授权
- 认证(支持多种认证方式) # 认证插件
- 令牌认证 bearer token
- ssl认证(确认服务端/客户端身份) 双向证书认证(https)
- …
- 授权检查(权限) # 授权插件
- RBAC # kubeadm部署的集群强制开启RBAC
- …
- 准入控制(关联的其他资源或操作 是否有权限 进一步补充授权机制)
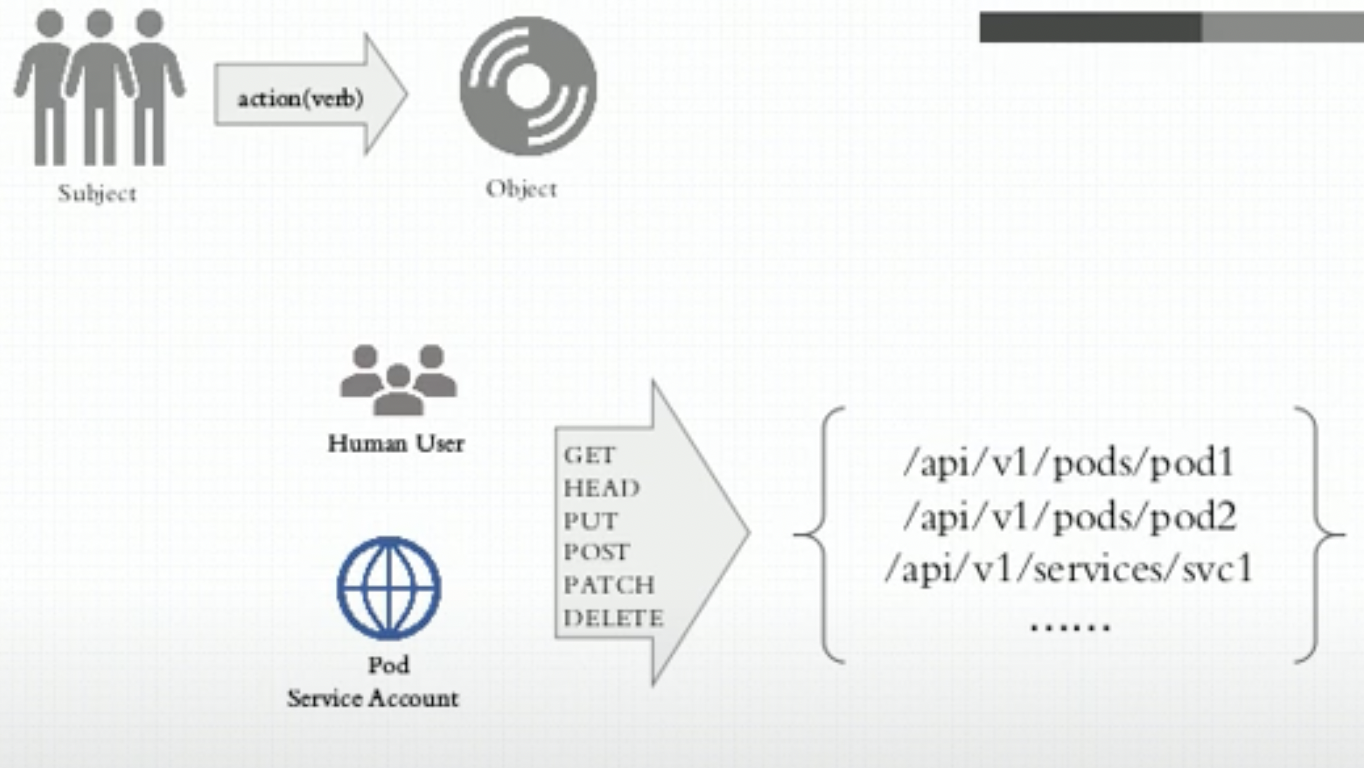
- API Server需要信息去识别客户端的操作
- user: username + uid
- group
- extra
- API(请求的Kubernetes API)
- Request Path
kubectl proxy --port=8080curl http://localhost:8080/api/v1/namespacescurl http://localhost:8080/apis/apps/v1/namespaces/default/deployments/myapp-deploy/
- HTTP request verb
- GET POST PUT DELETE
- get list create update patch watch proxy redirect delete deletecollection
- Resources
- SubResources
- Namespace
- API Group
ServiceAccount
- 访问APIServer的两种客户端
- kubectl/dashborad 集群外部客户端(userAccount)
- pod 集群内部客户端(serviceAccount)
kubectl explain pods.spec.serviceAccountName
- kubeconfig
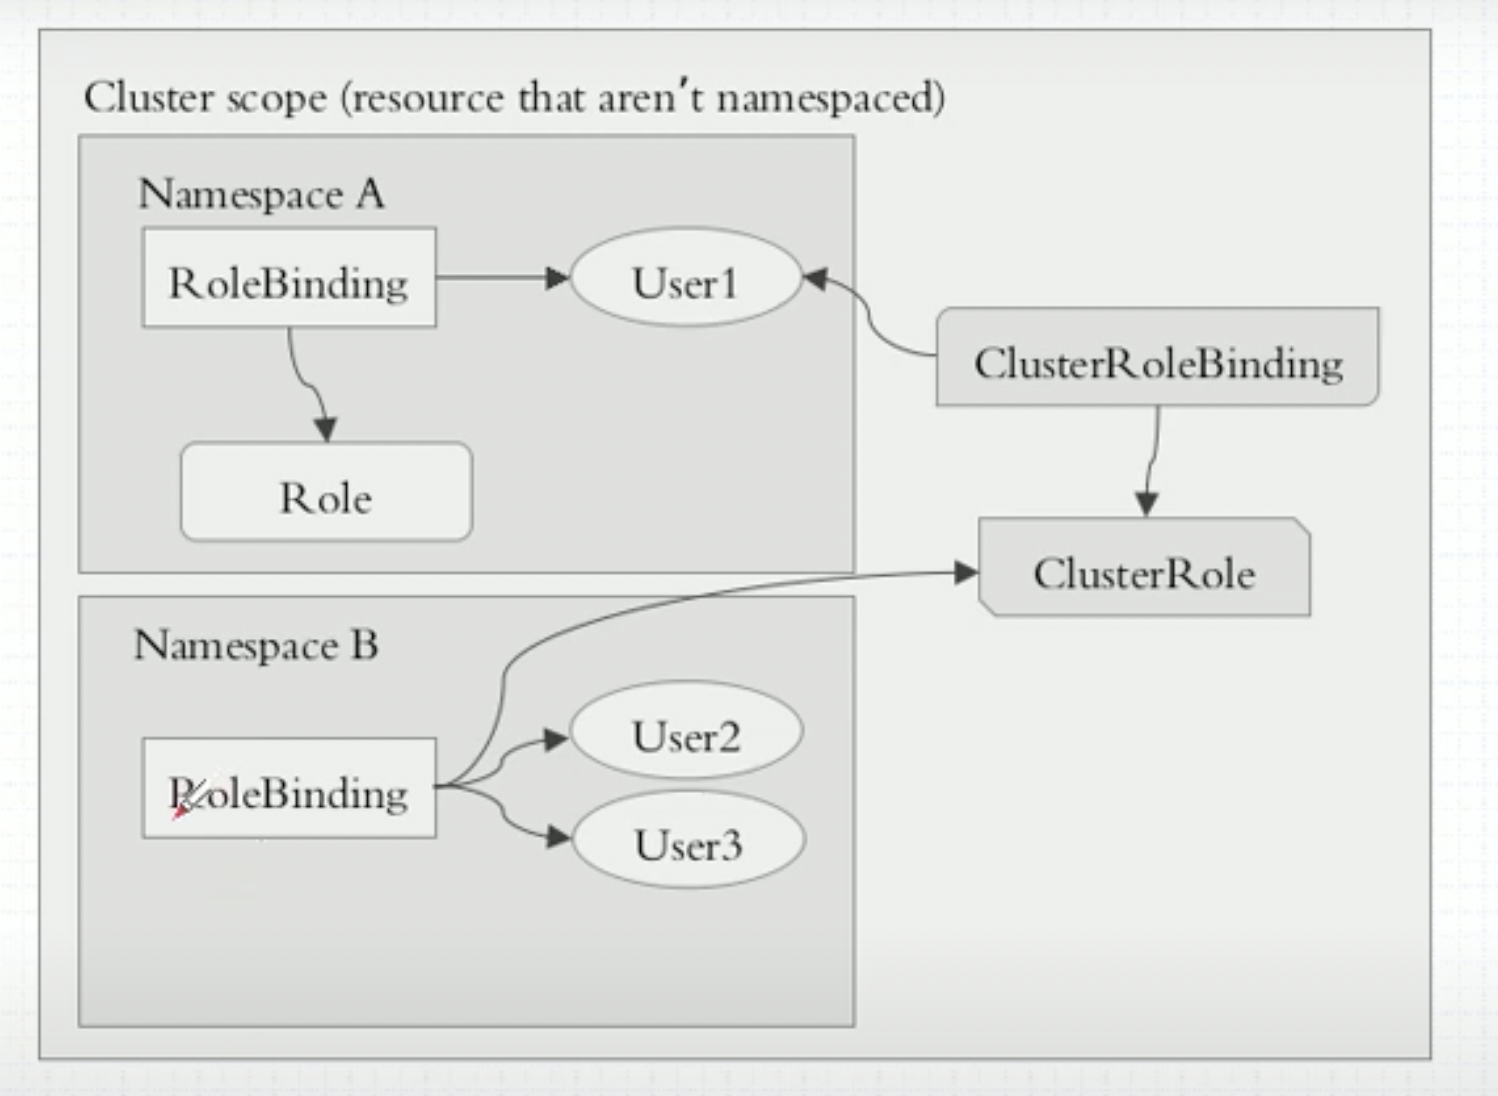
RBAC授权
- 授权插件
- Node
- ABAC(Attribute-based access control)
- RBAC(Role-based access contro)
- Webhook
- K8S-RBAC
- role
- rolebinding
- user account OR service account
- role
kubectl create role pods-reader --verb=get,list,watch --resource=pods --dry-run -o yaml
配置管理
Kustomize
kustomize
Helm
helm
模版debug
1
2
| {{- $commonValues := mustDeepCopy .Values.common -}}
{{ fail (printf "commonValues:%v\n" (toYaml .Values | nindent 2 )) }} // 格式化打印对应值 方便debug
|
集群监控
- 书籍推荐 了解Google运维的秘密 SRE: Google运维解密
- 资源监控方案 Prometheus 无可挑剔的选择 需前置Prometheus相关知识
- Kubernetes集群的监控方案主要有以下几种方案
- Heapster: 已废弃 使用metrics-server代替
- cAdvisor: cAdvisor是Google开源的容器资源监控和性能分析工具
- 它是专门为容器而生的 本身也支持Docker
- 在Kubernetes中 我们不需要单独去安装 cAdvisor作为kubectl内置的一部分程序 可以直接使用
- kube-state-metrics: kube-state-metrics通过监听API Server生成有关资源对象的状态指标
- 比如: Deployment、Node、Pod 需要注意的是 kube-state-metrics只是简单提供一个metrics数据 并不会存储这些指标数据
- 我们可以使用Prometheus来抓取这些数据然后存储
- metrics-server: metrics-server也是一个集群范围内的资源数据聚合工具 是Headster的替代
- 同样的 metrics-server也只是显示数据 并不提供数据存储服务
- kube-state-metrics 和 metrics-server的区别:
- kube-state-metrics主要关注的是业务相关的一些元数据 比如 Deployment、Pod、副本状态等
- metrics-server主要关注的是资源度量API的实现 比如 CPU、内存、文件描述符、请求延时等指标
手动安装Prometheus
- 资源清单文件
kubectl apply -f prometheus.yaml- 因为是以NodePort暴露的服务 直接访问
http://任意节点IP:<NodePort> 就能看到熟悉的Prometheus UI
 1
 2
 3
 4
 5
 6
 7
 8
 9
10
11
12
13
14
15
16
17
18
19
20
21
22
23
24
25
26
27
28
29
30
31
32
33
34
35
36
37
38
39
40
41
42
43
44
45
46
47
48
49
50
51
52
53
54
55
56
57
58
59
60
61
62
63
64
65
66
67
68
69
70
71
72
73
74
75
76
77
78
79
80
81
82
83
84
85
86
87
88
89
90
91
92
93
94
95
96
97
98
99
100
101
102
103
104
105
106
107
108
109
110
111
112
113
114
115
116
117
118
119
120
121
122
123
124
125
126
127
128
129
130
131
132
133
134
135
136
137
138
139
140
141
142
143
144
145
146
147
148
149
150
151
152
153
154
155
156
157
158
159
160
161
| # kubectl create ns kube-ops
# 暂时只配置对proemtheus的监控
apiVersion: v1
kind: ConfigMap
metadata:
name: prometheus-config
namespace: kube-ops
data:
prometheus.yaml: |
global:
scrape_interval: 15s
evaluation_interval: 15s
scrape_configs:
- job_name: 'prometheus'
static_configs:
- targets: ['localhost:9090']
---
# PVC for prometheus 使用NFS演示
apiVersion: v1
kind: PersistentVolumeClaim
metadata:
name: prometheus
namespace: kube-ops
spec:
storageClassName: nfs-client
accessModes:
- ReadWriteMany
resources:
requests:
storage: 10Gi
---
# 创建ServiceAccount
apiVersion: v1
kind: ServiceAccount
metadata:
name: prometheus
namespace: kube-ops
---
# 创建CllusterRole
apiVersion: rbac.authorization.k8s.io/v1
kind: ClusterRole
metadata:
name: prometheus
rules:
- apiGroups:
- ""
resources:
- nodes
- services
- endpoints
- pods
- nodes/proxy
verbs:
- get
- list
- watch
- apiGroups:
- ""
resources:
- configmaps
- nodes/metrics
verbs:
- get
- nonResourceURLs:
- /metrics
verbs:
- get
---
# 创建ClusterRoleBinding
apiVersion: rbac.authorization.k8s.io/v1
kind: ClusterRoleBinding
metadata:
name: prometheus
roleRef:
apiGroup: rbac.authorization.k8s.io
kind: ClusterRole
name: prometheus
subjects:
- kind: ServiceAccount
name: prometheus
namespace: kube-ops
---
# 创建Deployment
apiVersion: apps/v1
kind: Deployment
metadata:
name: prometheus
namespace: kube-ops
labels:
app: prometheus
spec:
selector:
matchLabels:
app: prometheus
template:
metadata:
labels:
app: prometheus
spec:
serviceAccountName: prometheus
containers:
- name: prometheus
image: prom/prometheus:v2.46.0
command:
- /bin/prometheus
args:
- --config.file=/etc/prometheus/prometheus.yaml
- --storage.tsdb.path=/prometheus
- --storage.tsdb.retention.time=24h
- --web.enable-admin-api
- --web.enable-lifecycle
ports:
- containerPort: 9090
protocol: TCP
name: http
volumeMounts:
- name: prometheus-config
mountPath: /etc/prometheus
- name: prometheus-storage
mountPath: /prometheus
# 只挂载卷中的一个子目录或子路径到容器中 而不是挂载整个卷
# 1. 避免数据污染
# 2. 多容器共享同一个PVC
# 3. 数据隔离
subPath: prometheus
resources:
requests:
cpu: 100m
memory: 512Mi
limits:
cpu: 100m
memory: 512Mi
securityContext:
runAsUser: 0
volumes:
- name: prometheus-config
configMap:
name: prometheus-config
- name: prometheus-storage
persistentVolumeClaim:
claimName: prometheus
---
# 创建Service
apiVersion: v1
kind: Service
metadata:
name: prometheus
namespace: kube-ops
labels:
app: prometheus
spec:
selector:
app: prometheus
type: NodePort
ports:
- name: http
port: 9090
targetPort: 9090
nodePort: 30000
|
监控集群应用
- 内置指标接口 直接配置静态配置service地址的内置指标接口
- 未内置指标接口 直接配置对应exporter的service地址的指标接口
监控集群节点
- 监控节点已有非常多的成熟方案 比如:Nagios Zabbix 甚至自己收集数据也可以
- Kubernetes中 我们通过node_exporter来获取节点指标
- node_exporter用于采集服务器节点的各种运行指标 包括:conntrack cpu diskstats filesystem loadavg memeinfo netstat等
- 详细内容参考官方repo文档
部署node-exporter
 1
 2
 3
 4
 5
 6
 7
 8
 9
10
11
12
13
14
15
16
17
18
19
20
21
22
23
24
25
26
27
28
29
30
31
32
33
34
35
36
37
38
39
40
41
42
43
44
45
46
47
48
49
50
51
52
53
54
55
56
57
58
59
60
61
62
63
64
65
66
67
68
69
| # 部署node-exporter的资源清单文件
# 注意事项:由于我们要获取到的数据是主机的监控指标数据 而node-exporter是运行在容器中的 所有在Pod中需要配置一些Pod的安全策略
# hostPID: true 允许容器访问主机的PID命名空间
# hostIPC: true 允许容器访问主机的IPC命名空间
# hostNetwork: true 允许容器使用主机的网络命名空间
# 另外 我们还将主机的/dev、/proc、/sys目录挂载到容器中 因为我们采集的很多节点数据都是通过这些目录下面的文件来获取的
# /proc/stat /proc/meminfo /proc/cpuinfo /proc/diskstats /proc/net/dev ...
apiVersion: apps/v1
kind: DaemonSet
metadata:
name: node-exporter
namespace: kube-ops
labels:
app: node-exporter
spec:
selector:
matchLabels:
app: node-exporter
template:
metadata:
labels:
app: node-exporter
spec:
hostPID: true
hostIPC: true
hostNetwork: true
containers:
- name: node-exporter
image: prom/node-exporter:v1.9.1
ports:
- containerPort: 9100
resources:
requests:
cpu: 200m
securityContext:
privileged: true
args:
- --path.procfs
- /host/proc
- --path.sysfs
- /host/sys
- --collector.filesystem.ignored-mount-points
- "^/(sys|proc|dev|host|etc)($|/)"
volumeMounts:
- name: dev
mountPath: /host/dev
- name: proc
mountPath: /host/proc
- name: sys
mountPath: /host/sys
- name: rootfs
mountPath: /rootfs
tolerations:
- key: node-role.kubernetes.io/control-plane
operator: Exists
effect: NoSchedule
volumes:
- name: dev
hostPath:
path: /dev
- name: proc
hostPath:
path: /proc
- name: sys
hostPath:
path: /sys
- name: rootfs
hostPath:
path: /
|
配置基于Kubernetes的自动发现
kubernetes_sd_config
- 在Kubernetes中 Prometheus通过与Kubernetes API集成 目前主要支持5种服务发现模式
- node
- service
- pod
- endpoints / endpointslice
- ingress
- 通过制定
kubernetes_sd_config的模式为node Prometheus就会自动从Kubernetes中发现所有的node节点并作为当前job监控的目标实例 发现的节点/metrics接口时默认的kubelet的HTTP接口 - Promethehs去发现Node模式的服务的时候 访问的默认端口是10250(kubelet服务端口) 而现在该端口下面已经没有/metrics指标数据
- 因为上面配置指定了
hostNetwork: true 所以每个节点都会监听9100端口 我们应该将这里的10250替换为9100 - 如何实现:使用Prometheus提供的
relabel_configs中的replace能力- relabel可以在Prometheus采集数据之前 通过Target实例的metadata信息 动态重新写入Label的值
- 除此之外 还能根据Target实例的metadata信息 选择是否采集或忽略该Target实例/指标
- 添加一个action为
labelmap 正则表达式__metadata_kubernetes_node_label_(.+)的配置 这里的意思是表达式中匹配的数据也添加到指标数据的Label标签中去 - 对于kubernetes_sd_config下面可用的标签如下:
__metadata_kubernetes_node_name: 节点对象的名称__metadata_kubernetes_node_label: 节点对象中的每个标签__metadata_kubernetes_node_annitation: 来自节点对象的每个注解__metadata_kubernetes_node_address: 每个节点地址类型的第一个地址(如果存在)- 更多类型参考Prometheus官方文档
- 修改后的configmap如下
 1
 2
 3
 4
 5
 6
 7
 8
 9
10
11
12
13
14
15
16
17
18
19
20
21
22
23
24
25
26
27
28
29
30
31
32
33
34
35
36
37
38
39
40
| apiVersion: v1
kind: ConfigMap
metadata:
name: prometheus-config
namespace: kube-ops
data:
prometheus.yaml: |
global:
scrape_interval: 15s
evaluation_interval: 15s
scrape_configs:
- job_name: 'prometheus'
static_configs:
- targets: ['localhost:9090']
- job_name: 'kubernetes-nodes'
kubernetes_sd_configs:
- role: node
relabel_configs:
- source_labels: [__address__]
regex: '(.+):10250'
replacement: '${1}:9100'
target_label: __address__
action: replace
- action: labelmap
regex: __meta_kubernetes_node_label_(.+)
# 1.11+版本后 metrics端口为10250 需要使用https协议获取指标
- job_name: 'kubernetes-kubelet'
kubernetes_sd_configs:
- role: node
scheme: https
tls_config:
ca_file: /var/run/secrets/kubernetes.io/serviceaccount/ca.crt
insecure_skip_verify: true
bearer_token_file: /var/run/secrets/kubernetes.io/serviceaccount/token
relabel_configs:
- action: labelmap
regex: __meta_kubernetes_node_label_(.+)
|
监控集群常用资源对象
容器监控
- 说到容器监控我们自然会想到cAdisor 我们前面说过cAdvisor已经内置在了kubelet组件中 所以我们不需要单独安装
- cAdvisor的数据路径为
/api/v1/nodes/<node>/proxy/metrics - 同样 我们使用node的服务发现模式 因为每一个节点下面都有kubelet 自然都有cAdvisor采集到的数据指标
1
2
3
4
5
6
7
8
9
10
11
12
13
14
15
16
17
| # prometheus configmap配置参考
- job_name: 'kubernetes-cadvisor'
kubernetes_sd_configs:
- role: node
scheme: https
tls_config:
ca_file: /var/run/secrets/kubernetes.io/serviceaccount/ca.crt
bearer_token_file: /var/run/secrets/kubernetes.io/serviceaccount/token
relabel_configs:
- action: labelmap
regex: __meta_kubernetes_node_label_(.+)
- target_label: __address__
replacement: kubernetes.default.svc:443
- source_labels: [__meta_kubernetes_node_name]
regex: (.+)
target_label: __metrics_path__
replacement: /api/v1/nodes/${1}/proxy/metrics/cadvisor
|
apiserver监控
- apiserver作为Kubernetes的最核心组件 对它的监控是非常必要的
- 对于apiserver的监控我们可以直接通过kubernetes的Service来获取
kubectl get svc kubernetes -n default
1
2
3
4
5
6
7
8
9
10
11
12
13
14
| - job_name: 'kubernetes-apiservers'
kubernetes_sd_configs:
- role: endpoints
scheme: https # https协议
tls_config:
ca_file: /var/run/secrets/kubernetes.io/serviceaccount/ca.crt
bearer_token_file: /var/run/secrets/kubernetes.io/serviceaccount/token
relabel_configs:
- source_labels:
- __meta_kubernetes_namespace
- __meta_kubernetes_service_name
- __meta_kubernetes_endpoint_port_name
action: keep # 使用endpoints的自动发现 会发现所有的endpoitns端点 我们只需要匹配kubernetes-apiserver 其余全部DROP
regex: default;kubernetes;https
|
- Kubernetes系统组件指标
- 应用上面配置 就完成了对Kubernetes APIServer的监控
- 如果需要监控其他系统组件 比如:kube-controller-manager、kube-scheduler的话 需要注意
- apiserver的service在default的namespace下
- 而其余组件服务在kube-system这个namespace下 如果我们想要监控这些组件 需要手动创建单独的Service 其中
- kube-schedule的指标数据端口为10251
- kube-controller-manager对应的指标数据端口为10252
Service监控
- 上面的apiservice实际上是一种特殊的Service 我们可以配置一个任务来专门发现普通类型的Service
 1
 2
 3
 4
 5
 6
 7
 8
 9
10
11
12
13
14
15
16
17
18
19
20
21
22
23
24
25
26
27
28
29
30
31
32
33
34
35
| - job_name: 'kubernetes-service-endpoints'
kubernetes_sd_configs:
- role: endpoints
relabel_configs:
- source_labels:
- __meta_kubernetes_service_annotation_prometheus_io_scrape
action: keep
regex: true
- source_labels:
- __meta_kubernetes_service_annotation_prometheus_io_scheme
action: replace
target_label: __scheme__
regex: (https?)
- source_labels:
- __meta_kubernetes_service_annotation_prometheus_io_path
action: replace
target_label: __metrics_path__
regex: (.+)
- source_labels:
- __address__
- __meta_kubernetes_service_annotation_prometheus_io_port
action: replace
target_label: __address__
regex: ([^:]+)(?::\d+)?;(\d+)
replacement: $1:$2
- action: labelmap
regex: __meta_kubernetes_service_label_(.+)
- source_labels:
- __meta_kubernetes_namespace
action: replace
target_label: kubernetes_namespace
- source_labels:
- __meta_kubernetes_service_name
action: replace
target_label: kubernetes_name
|
- 需要被监控的服务 如果本身实现了
/metrics接口 则可以按照下面配置修改下Service配置即可进行自动发现
1
2
3
4
5
6
7
8
9
10
11
12
13
14
15
| apiVersion: v1
kind: Service
metadata:
name: demoapp
namespace: default
annotations: # 加上下面的annotations 则可以进行该服务的自动发现
prometheus.io/scrape: "true"
prometheus.io/port: "80"
spec:
selector:
app: demoapp
ports:
- protocol: TCP
port: 80
targetPort: 80
|
kube-state-metrics
上面我们配置了自动发现Service(Pod也一样)的监控 但是这些监控数据都是应用内部的监控 需要应用本身内置/metrics接口 或者对应的exporter来暴露对应的指标数据
但是 在Kubernetes集群上的Pod、DaemonSet、Deployment、Job、Crontab等各种资源对象的状态也需要监控 这也反应了使用这些资源部署的应用状态
前面从集群拉取的指标(来自apiserver和kubelet中集成的cAdvisor) 并没有具体的各种资源对象的状态指标
对于Prometheus来说 当然是需要引入新的exporter来暴露这些指标 Kubernetes提供了kube-state-metrics则可以实现该监控需求
安装kube-state-metrics
1
2
| git clone git@github.com:kubernetes/kube-state-metrics.git
kubectl apply -k examples/standard
|
1
2
3
4
5
6
7
8
9
10
11
12
13
14
15
16
17
18
19
20
21
22
23
24
| apiVersion: v1
kind: Service
metadata:
labels:
app.kubernetes.io/component: exporter
app.kubernetes.io/name: kube-state-metrics
app.kubernetes.io/version: 2.15.0
name: kube-state-metrics
namespace: kube-system
# 修改service 加上该配置
annotations:
prometheus.io/scrape: "true"
prometheus.io/port: "8080"
spec:
clusterIP: None
ports:
- name: http-metrics
port: 8080
targetPort: http-metrics
- name: telemetry
port: 8081
targetPort: telemetry
selector:
app.kubernetes.io/name: kube-state-metrics
|
Grafana的安装使用
- Prometheus官方Dashboard展示能力较弱 展示推荐接Grafana
- 安装
 1
 2
 3
 4
 5
 6
 7
 8
 9
10
11
12
13
14
15
16
17
18
19
20
21
22
23
24
25
26
27
28
29
30
31
32
33
34
35
36
37
38
39
40
41
42
43
44
45
46
47
48
49
50
51
52
53
54
55
56
57
58
59
60
61
62
63
64
65
66
67
68
69
70
71
72
73
74
75
76
77
78
79
80
81
82
83
84
85
86
87
88
89
90
91
92
93
94
95
96
| apiVersion: apps/v1
kind: Deployment
metadata:
name: grafana
namespace: kube-ops
labels:
app: grafana
spec:
revisionHistoryLimit: 10
selector:
matchLabels:
app: grafana
template:
metadata:
labels:
app: grafana
spec:
containers:
- name: grafana
image: grafana/grafana:12.0.1
imagePullPolicy: IfNotPresent
ports:
- containerPort: 3000
name: grafana
env:
- name: GF_SECURITY_ADMIN_USER
value: admin
- name: GF_SECURITY_ADMIN_PASSWORD
value: admin9527
readinessProbe:
failureThreshold: 3
httpGet:
path: /api/health
port: 3000
scheme: HTTP
initialDelaySeconds: 60
periodSeconds: 10
successThreshold: 1
timeoutSeconds: 30
livenessProbe:
failureThreshold: 10
httpGet:
path: /api/health
port: 3000
scheme: HTTP
periodSeconds: 10
successThreshold: 1
timeoutSeconds: 1
resources:
limits:
cpu: 100m
memory: 256Mi
requests:
cpu: 100m
memory: 256Mi
volumeMounts:
- mountPath: /var/lib/grafana
subPath: grafana
name: storage
securityContext:
fsGroup: 472
runAsUser: 472
volumes:
- name: storage
persistentVolumeClaim:
claimName: grafana
---
apiVersion: v1
kind: PersistentVolumeClaim
metadata:
name: grafana
namespace: kube-ops
spec:
storageClassName: nfs-client
accessModes:
- ReadWriteOnce
resources:
requests:
storage: 1Gi
---
apiVersion: v1
kind: Service
metadata:
name: grafana
namespace: kube-ops
labels:
app: grafana
spec:
type: NodePort
ports:
- name: http
port: 3000
targetPort: 3000
nodePort: 30001
selector:
app: grafana
|
1
2
3
4
5
6
7
8
9
10
11
12
13
14
15
16
17
18
19
20
21
22
| apiVersion: batch/v1
kind: Job
metadata:
name: grafana-chown
namespace: kube-ops
spec:
template:
spec:
restartPolicy: Never
containers:
- name: grafana-chown
command: ["chown", "-R", "472:472", "/var/lib/grafana"]
image: busybox
imagePullPolicy: IfNotPresent
volumeMounts:
- name: storage
subPath: grafana
mountPath: /var/lib/grafana
volumes:
- name: storage
persistentVolumeClaim:
claimName: grafana
|
- 后续就是进行Grafana的数据源及模版配置等工作
Alertmanger
- 准备告警媒介 这里以dingding-webhoo为例
1
2
3
| git clone git@github.com:timonwong/prometheus-webhook-dingtalk.git
cd contrib/k8s
kubectl apply -k . # 执行前修改为自己的测试配置
|
1
2
3
4
5
6
7
8
9
10
11
12
13
14
15
16
17
18
19
20
21
22
23
24
25
26
27
28
29
30
31
32
33
34
35
36
37
38
39
40
41
42
43
44
45
46
47
48
| apiVersion: v1
kind: ConfigMap
metadata:
name: alertmanager-config
namespace: kube-ops
data:
config.yaml: |-
route:
receiver: 'default'
group_wait: 30s
group_interval: 5m
repeat_interval: 30m
group_by:
- 'cluster'
- 'alertname'
routes:
- receiver: 'test'
group_wait: 30s
group_interval: 10m
repeat_interval: 30m
matchers:
- severity="P0"
receivers:
- name: 'default'
webhook_configs:
- url: 'http://alertmanager-webhook-dingtalk/dingtalk/webhook_mention_test/send'
send_resolved: false
- name: 'test'
webhook_configs:
- url: 'http://alertmanager-webhook-dingtalk/dingtalk/webhook_mention_test/send'
send_resolved: false
inhibit_rules:
- source_matchers:
- severity = 'P0'
target_matchers:
- severity =~ 'P1|P2|P3|P4|P5'
equal:
- 'alertname'
- 'instance'
- source_matchers:
- alertname = InstanceDown
target_matchers:
- job = node_exporter
equal:
- 'instance'
|
1
2
3
4
5
6
7
8
9
10
11
12
13
14
15
16
17
18
19
20
21
22
23
24
| # 为了方便 我这里直接把alertmanager和prometheus部署在一起
- name: alertmanager
image: prom/alertmanager:v0.28.1
imagePullPolicy: IfNotPresent
args:
- --config.file=/etc/alertmanager/config.yaml
ports:
- containerPort: 9093
protocol: TCP
name: http
volumeMounts:
- name: alertmanager-config
mountPath: /etc/alertmanager
resources:
requests:
cpu: 100m
memory: 512Mi
limits:
cpu: 100m
memory: 512Mi
volumes:
- name: alertmanager-config
configMap:
name: alertmanager-config
|
- 在prometheus中配置alertmanager地址
1
2
3
4
5
6
| # 更新promtehus配置的configmap
alerting:
alertmanagers:
- static_configs:
- targets:
- localhost:9093 # 同一个Pod 直接使用localhost
|
1
2
3
4
5
6
7
8
9
10
11
12
13
14
15
16
| rule_files:
- /etc/prometheus/rules.yaml
# configmap 新增一个配置项
rules.yaml: |
groups:
- name: test-rules
rules:
- alert: NodeMemoryUsage
expr: (node_memory_MemTotal_bytes - (node_memory_MemFree_bytes + node_memory_Buffers_bytes + node_memory_Cached_bytes)) / node_memory_MemTotal_bytes * 100 > 20
for: 2m
labels:
severity: P0
annotations:
summary: "{{ $labels.instance }}: High Memory usage detected"
description: "{{$labels.instance}}: Memory usage is above 20% (current value is: {{ $value }}"
|
Prometheus Operator
- 经过上面手动编写Prometheus资源清单 我们完成了对Kubernetes相关资源的监控 但是还是有一些缺陷
- 比如:Promtheus、Alertmanager等组件服务本身的高可用;当然我们可以自己实现这些需求 我们也知道Prometheus在代码上就原生支持Kubernetes 我们可以通过服务发现的形式来自动监控集群
- 因此 我们可以使用另外一种更加高级的方式来部署Prometheus: prometheus-operator
Operator模式
Operator参考:Operator模式
介绍
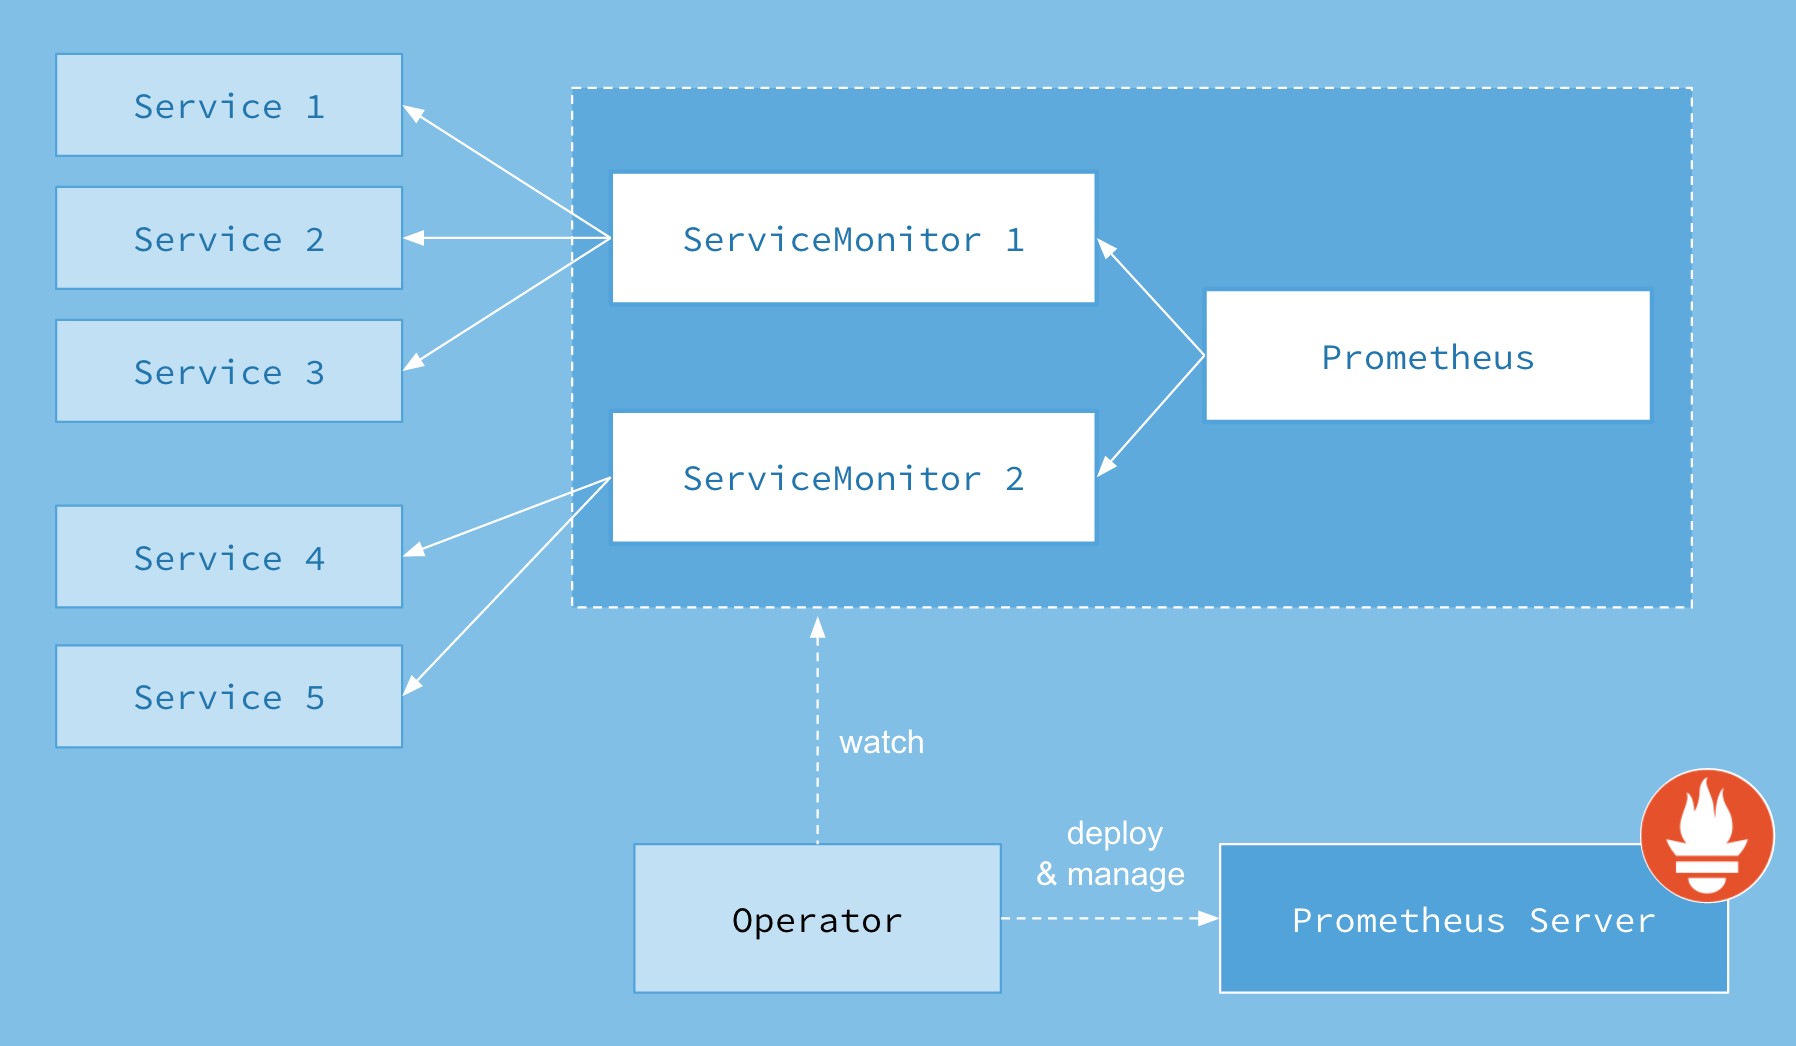
- 上图是
Prometheus-Operator官方提供的架构图 其中Operator是最核心的部分 - 作为一个控制器 它回去创建
Prometheus、ServiceMonitor、Alertmanager以及PrometheusRule4个CRD资源对象 然后会一直监控并维持这4个资源对象的状态prometheus资源对象就是作为Prometheus Server存在ServiceMonitor就是exporter的各种抽象 Prometheus就是通过ServiceMonitor提供的metrics数据接口去pull数据alertmanager资源对应Alertmanager的抽象PrometheusRule是用来被Prometheus实例使用的报警规则文件
- 这样 我们要在集群中监控什么数据 就变成了直接去操作Kubernetes集群资源的对象
- 上图中的Service和ServiceMonitor都是Kubernetes的资源 一个ServiceMonitror可以通过labelSelector的方式去匹配一类Service
- Prometheus也可以通过labelSelector的发方式去匹配多个ServiceMonitor
通过prometheus-operator安装
1
2
3
4
5
6
7
8
9
10
11
12
13
14
15
16
17
18
19
20
| git clone git@github.com:prometheus-operator/prometheus-operator.git
kubectl create namespace monitoring
# 在指定namespace安装
$ NAMESPACE=monitoring kustomize edit set namespace $NAMESPACE && kubectl create -k .
customresourcedefinition.apiextensions.k8s.io/alertmanagerconfigs.monitoring.coreos.com created
customresourcedefinition.apiextensions.k8s.io/alertmanagers.monitoring.coreos.com created
customresourcedefinition.apiextensions.k8s.io/podmonitors.monitoring.coreos.com created
customresourcedefinition.apiextensions.k8s.io/probes.monitoring.coreos.com created
customresourcedefinition.apiextensions.k8s.io/prometheusagents.monitoring.coreos.com created
customresourcedefinition.apiextensions.k8s.io/prometheuses.monitoring.coreos.com created
customresourcedefinition.apiextensions.k8s.io/prometheusrules.monitoring.coreos.com created
customresourcedefinition.apiextensions.k8s.io/scrapeconfigs.monitoring.coreos.com created
customresourcedefinition.apiextensions.k8s.io/servicemonitors.monitoring.coreos.com created
customresourcedefinition.apiextensions.k8s.io/thanosrulers.monitoring.coreos.com created
serviceaccount/prometheus-operator created
clusterrole.rbac.authorization.k8s.io/prometheus-operator created
clusterrolebinding.rbac.authorization.k8s.io/prometheus-operator created
service/prometheus-operator created
deployment.apps/prometheus-operator created
|
- PrometheusOperator通过Deployment的形式进行部署
- 为了能够让PrometheusOperator能够监听和管理Kubernetes资源 同时也创建了单独的ServiceAccount以及相关授权
使用Operator管理Prometheus
部署Prometheus实例
- 当集群中已经安装ProemtheusOperator之后 对于部署PromtheusServer实例变成了声明一个Prometheus资源
- 如下所示 我们在monitoring名称空间下创建了一个Prometheus实例
- 访问:
kubectl port-forward statefulsets.apps/prometheus-inst 9090:9090
1
2
3
4
5
6
7
8
9
| apiVersion: monitoring.coreos.com/v1
kind: Prometheus
metadata:
name: inst
namespace: monitoring
spec:
resources:
requests:
memory: 400Mi
|
部署ServiceMonitor实例
- 让部署的Prometheus能够采集部署在Kubernetes下应用的监控数据
- 在原生的Prometheus配置方式中 我们在Prometheus配置文件中定义单独的Job 同时使用
kubernetes_sd定义服务的自动发现 - 在PrometheusOperator中 则可以直接声明一个
ServiceMonitor对象
 1
 2
 3
 4
 5
 6
 7
 8
 9
10
11
12
13
14
15
16
17
18
19
20
21
22
23
24
25
26
27
28
29
30
31
32
33
34
35
| apiVersion: monitoring.coreos.com/v1
kind: ServiceMonitor
metadata:
name: demoapp
namespace: monitoring
labels:
env: testing
spec:
namespaceSelector:
matchNames:
- default
selector:
matchLables:
app: demoapp
endpoints:
- port: web
# 如果target启用了监控BasicAuth认证 定义ServiceMonitor对象时 需要在endpoints配置中定义basicAuth
basicAuth:
password:
name: basic-auth
key: password
username:
name: basic-auth
key: user
# 其中 basicAuth 中关联名为 basic-auth为Secret对象 需要用户手动将认证信息保存到Secret中
APIVersion: v1
kind: Secret
metadata:
name: basic-auth
data:
# base64编码后的值
password: alsdhabdn==
user: Jadquhwe==
type: Opaque
|
关联Prometheus与ServiceMonitor
- Promtheus与ServiceMonitor之间的关联关系使用
servicMonitorSelector定义 在Prometheus中通过标签选择当前需要监控的ServiceMonitor对象 - 为了能够让Prometheus关联到ServiceMonitor 需要在Promehteus定义中使用serviceMonitorSelector 我们可以通过标签选择当前Prometheus需要监控的ServiceMonitor对象
1
2
3
4
5
6
7
8
9
10
11
12
13
| # 更新promteheus crd资源清单
apiVersion: monitoring.coreos.com/v1
kind: Prometheus
metadata:
name: inst
namespace: monitoring
spec:
serviceMonitorSelector:
matchLabels:
env: testing
resources:
requests:
memory: 400Mi
|
- 更新上面配置配置后 web界面可以看到Job配置 但是Prometheus的Target中并没有包含任何的监控对象 此时Promtheus Pod有报错日志
1
| time=2025-06-09T16:29:10.559Z level=ERROR source=reflector.go:166 msg="Unhandled Error" component=k8s_client_runtime logger=UnhandledError err="pkg/mod/k8s.io/client-go@v0.32.3/tools/cache/reflector.go:251: Failed to watch *v1.Service: failed to list *v1.Service: services is forbidden: User \"system:serviceaccount:monitoring:default\" cannot list resource \"services\" in API group \"\" in the namespace \"default\""
|
- 这是因为我们默认创建的实例使用的是monitoring命名空间下的default账号 该账号并没有权限能够获取default命名空间下的任何资源信息
- 修复该问题 我们需要在monitoring的命名空间常见一个新的ServiceAccount账号 并且为该账号赋予相应的集群访问权限
1
2
3
4
5
| $ kubectl get pods prometheus-inst-0 -o yaml
# 默认使用的serviceAccount
serviceAccount: default
serviceAccountName: default
|
 1
 2
 3
 4
 5
 6
 7
 8
 9
10
11
12
13
14
15
16
17
18
19
20
21
22
23
24
25
26
27
28
29
30
31
32
33
34
35
36
37
38
39
40
41
42
43
44
45
46
47
48
49
50
51
52
53
| # 创建新的具有相关权限的ServiceAccount
apiVersion: v1
kind: ServiceAccount
metadata:
name: prometheus
namespace: monitoring
---
apiVersion: rbac.authorization.k8s.io/v1
kind: ClusterRole
metadata:
name: prometheus
rules:
- apiGroups: [""]
resources:
- nodes
- services
- endpoints
- pods
verbs: ["get", "list", "watch"]
- apiGroups: [""]
resources:
- configmaps
verbs: ["get"]
- nonResourceURLs: ["/metrics"]
verbs: ["get"]
---
apiVersion: rbac.authorization.k8s.io/v1
kind: ClusterRoleBinding
metadata:
name: prometheus
roleRef:
apiGroup: rbac.authorization.k8s.io
kind: ClusterRole
name: prometheus
subjects:
- kind: ServiceAccount
name: prometheus
namespace: monitoring
# 应用上面资源清单之后 修改prometheus实例的资源清单 使用新的ServiceAccount
apiVersion: monitoring.coreos.com/v1
kind: Prometheus
metadata:
name: inst
namespace: monitoring
spec:
serviceAccountName: prometheus # 更新serviceAccount
serviceMonitorSelector:
matchLabels:
env: testing
resources:
requests:
memory: 400Mi
|
使用Operator管理监控配置
使用PrometheusRule定义告警规则
- 对于Prometheus而言 在原生的管理方式上 我们需要手动创建Prometheus的告警文件 并且通过在Prometheus配置中声明式加载
- 而在PrometheusOperator的模式中 告警规则通过定义声明式配置创建一个
PrometheusRule资源
1
2
3
4
5
6
7
8
9
10
11
12
13
| apiVersion: monitoring.coreos.com/v1
kind: PrometheusRule
metadata:
labels:
prometheus: demoapp
role: alert-rules
name: prometheus-demoapp-rules
spec:
groups:
- name: ./demoapp.rules
rules:
- alert: DemoappAlert
expr: demoapp_http_requests_total{handler="/metrics"} > 1
|
- 创建
PrometheusRule资源后 通过在Promtheus中使用ruleSelector通过标签选择需要关联的PrometheusRule即可
1
2
3
4
5
6
7
8
9
10
11
12
13
14
15
16
17
| apiVersion: monitoring.coreos.com/v1
kind: Prometheus
metadata:
name: inst
namespace: monitoring
spec:
serviceAccountName: prometheus
serviceMonitorSelector:
matchLabels:
env: testing
ruleSelector:
matchLabels:
role: alert-rules
prometheus: demoapp
resources:
requests:
memory: 400Mi
|
使用Operator管理Alertmanger实例
- 到目前为止 我们已经通过PrometheusOperator的自定义资源类型管理了Prometheus实例 监控配置以及告警规则等资源
- 通过PrometheusOperator将原本手动管理的工作 全部变成了声明式的管理模式 极大简化了Kubernetes下Prometheus运维管理的复杂度
- 我们继续使用Operator定义和管理Alertmanager相关的内容
- 创建Alertmanger资源清单
- 通过replicas可以控制Alertmanager的实例数
- 当replicas大于1时 PrometheusOperator会自动通过集群的方式创建Alertmaager
1
2
3
4
5
6
7
| apiVersion: monitoring.coreos.com/v1
kind: Alertmanager
metadata:
name: inst
namespace: monitoring
spec:
replicas: 3
|
- 修改Prometheus资源定义 配置
alerting指定使用的Alertmanager资源即可
1
2
3
4
5
6
7
8
9
10
11
12
13
14
15
16
17
18
19
20
21
22
| apiVersion: monitoring.coreos.com/v1
kind: Prometheus
metadata:
name: inst
namespace: monitoring
spec:
serviceAccountName: prometheus
serviceMonitorSelector:
matchLabels:
env: testing
ruleSelector:
matchLabels:
role: alert-rules
prometheus: demoapp
alerting:
alertmanagers:
- name: alertmanager-example
namespace: monitoring
port: web
resources:
requests:
memory: 400Mi
|
- 等待Prometheus重新加载后 我们可以看到PrometheusOperator在配置文件中添加了如下配置 通过服务发现规则 将Prometheus与Alertmanager自动关联
1
2
3
4
5
6
7
8
9
10
11
12
13
14
15
16
17
18
19
20
21
22
23
24
25
26
27
28
29
30
31
32
33
| alerting:
alert_relabel_configs:
- separator: ;
regex: prometheus_replica
replacement: $1
action: labeldrop
alertmanagers:
- follow_redirects: true
enable_http2: true
scheme: http
path_prefix: /
timeout: 10s
api_version: v2
relabel_configs:
- source_labels: [__meta_kubernetes_service_name]
separator: ;
regex: alertmanager-example
replacement: $1
action: keep
- source_labels: [__meta_kubernetes_endpoint_port_name]
separator: ;
regex: web
replacement: $1
action: keep
kubernetes_sd_configs:
- role: endpoints
kubeconfig_file: ""
follow_redirects: true
enable_http2: true
namespaces:
own_namespace: false
names:
- monitoring
|
在PrometheusOperator中使用自定义配置
- 在PrometheusOperator中 我们通过声明式创建Prometheus、ServiceMonitor等自定义的资源类型来自动化部署和管理Promtehues的相关组件及配置
- 而在一些特殊的情况下 可能还是希望能够手动管理Prometheus配置文件 而非通过PrometheusOperator自动完成
- 为什么? 实际上PrometheusOperator对于Job的配置只适用于在Kubernetes中部署和管理的应用程序 如果你希望使用Prometheus监控一些其他的资源 例如 AWS或其他平台中的基础设施或应用 这些并不在PrometheusOperator的能力范围之内
- 为了能够在通过PrometheusOperator创建的Prometheus实例中使用自定义配置文件 我们只能创建一个不包含任何与配置文件内容相关的Prometheus实例
1
2
3
4
5
6
7
8
9
10
| apiVersion: monitoring.coreos.com/v1
kind: Prometheus
metadata:
name: inst-cc
namespace: monitoring
spec:
serviceAccountName: prometheus
resources:
requests:
memory: 400Mi
|
- 如果查看新建的Prometheus的Pod实例的YAML定义 我们可以看到Pod中会包含一个volume配置
1
2
3
4
5
| volumes:
- name: config
secret:
defaultMode: 420
secretName: prometheus-inst-cc
|
- Prometheus的配置文件实例上是保存在名为
prometheus-<name-of-prometheus-object>的Secret中 - 当用户创建的Prometheus中关联ServiceMonitor这类会影响配置文件内容的定义时 PromtheusOperator会自动管理
- 而如果Prometheus定义中不包含任何与配置有关的定义 那么Secret的管理权限就落到用户自己手中
1
2
3
4
5
6
| # 使用该配置更新secret观察新建Prometheus实例的配置变化
# kubectl edit secret prometheus-inst-cc
global:
scrape_interval: 10s
scrape_timeout: 10s
evaluation_interval: 10s
|
通过kube-prometheus安装
Install using Kube-Prometheus
安装
1
2
3
4
5
6
7
8
9
10
11
12
13
14
15
16
17
18
19
20
21
| git clone git@github.com:prometheus-operator/kube-prometheus.git
kubectl create -f manifests/setup -f manifest # 不止包含我们上面手动创建的相关资源
# 查看部署的Pod
# kubectl get pods -n monitoring
NAME READY STATUS RESTARTS AGE
alertmanager-main-0 2/2 Running 0 2d23h
alertmanager-main-1 2/2 Running 0 2d23h
alertmanager-main-2 2/2 Running 0 2d23h
blackbox-exporter-75c7985cb8-dq9vp 3/3 Running 0 2d23h
grafana-664dd67585-wxrsp 1/1 Running 0 2d23h
kube-state-metrics-75df9b9544-j9l7t 3/3 Running 0 2d23h
node-exporter-9cflz 2/2 Running 0 2d23h
node-exporter-d9zkn 2/2 Running 0 2d23h
node-exporter-fh7sx 2/2 Running 0 2d23h
node-exporter-zxswn 2/2 Running 0 2d23h
prometheus-adapter-84c549f6b4-mwj8h 1/1 Running 0 2d23h
prometheus-adapter-84c549f6b4-tg2sv 1/1 Running 0 2d23h
prometheus-k8s-0 2/2 Running 0 2d23h
prometheus-k8s-1 2/2 Running 0 2d23h
prometheus-operator-6f9479b5f5-8r6sn 2/2 Running 0 2d23h
|
- 仔细观察我们发现
kube-scheduler kube-controller-manager两个服务定义了ServiceMonior 但是没有管理到对应的监控目标 - 阅读ServiceMonitor的定义 我们发现原因是我们系统中根本就没有对应的Service 我们手动创建即可
- 服务端口参考: ports-and-protocols
 1
 2
 3
 4
 5
 6
 7
 8
 9
10
11
12
13
14
15
16
17
18
19
20
21
22
23
24
25
26
27
28
29
30
31
32
33
34
35
36
37
38
39
40
41
| # serviceMonitor定义
# kube-controller-manager
apiVersion: monitoring.coreos.com/v1
kind: ServiceMonitor
metadata:
labels:
app.kubernetes.io/name: kube-controller-manager
app.kubernetes.io/part-of: kube-prometheus
name: kube-controller-manager
namespace: monitoring
spec:
endpoints:
- ...
jobLabel: app.kubernetes.io/name
namespaceSelector:
matchNames:
- kube-system
selector:
matchLabels:
app.kubernetes.io/name: kube-controller-manager
# kube-scheduler
apiVersion: monitoring.coreos.com/v1
kind: ServiceMonitor
metadata:
labels:
app.kubernetes.io/name: kube-scheduler
app.kubernetes.io/part-of: kube-prometheus
name: kube-scheduler
namespace: monitoring
spec:
endpoints:
- ...
jobLabel: app.kubernetes.io/name
namespaceSelector:
matchNames:
- kube-system
selector:
matchLabels:
app.kubernetes.io/name: kube-scheduler
|
- 根据serviceMonitor定义 创建具有对应标签的Service资源
1
2
3
4
5
6
7
8
9
10
11
12
13
14
15
16
17
18
19
20
21
22
23
24
25
26
27
28
29
30
31
32
33
34
35
36
| # 除了创建Service 还需要修改服务的默认监听地址 默认绑定127.0.0.1
# 修改: --address=127.0.0.1 -> --address=0.0.0.0
# kube-controller-manager
apiVersion: v1
kind: Service
metadata:
namespace: kube-system
name: kube-controller-manager
labels:
app.kubernetes.io/name: kube-controller-manager
spec:
selector:
component: kube-controller-manager
ports:
- name: https-metrics
port: 10257
targetPort: 10257
protocol: TCP
# kube-scheduler
apiVersion: v1
kind: Service
metadata:
namespace: kube-system
name: kube-scheduler
labels:
app.kubernetes.io/name: kube-scheduler
spec:
selector:
component: kube-scheduler
ports:
- name: https-metrics
port: 10259
targetPort: 10259
protocol: TCP
|
PrometheusOperator高级配置
- 经常上面操作之后 自带组件的相关监控都全部配置完成 但是 如果我们集群中有很多的Service/Pod 我们就需要一个个创建对应的ServiceMonitor对象么
- 为了解决这个问题 PrometheusOperator为我们提供了一个额外的抓取配置来解决这个问题 我们可以通过添加额外的配置来进行服务发现进行自动监控
- 和之前自定义的方式呢一样 我们想要在PrometheusOperator中去自动发现具有
prometheus.io/scrape=true这个annotations的Service 之前我们定义的Prometheus配置如下
1
2
3
4
5
6
7
8
9
10
11
12
13
14
15
16
17
18
19
20
21
22
23
24
25
26
27
28
29
30
31
32
33
| - job_name: 'kubernetes-service-endpoints'
kubernetes_sd_configs:
- role: endpoints
relabel_configs:
- source_labels: [__meta_kubernetes_service_annotation_prometheus_io_scrape]
action: keep
regex: true
- source_labels: [__meta_kubernetes_service_annotation_prometheus_io_scheme]
action: replace
target_label: __scheme__
regex: (https?)
- source_labels: [__meta_kubernetes_service_annotation_prometheus_io_path]
action: replace
target_label: __metrics_path__
regex: (.+)
- source_labels: [__address__, __meta_kubernetes_service_annotation_prometheus_io_port]
action: replace
target_label: __address__
regex: ([^:]+)(?::\d+)?;(\d+)
replacement: $1:$2
- action: labelmap
regex: __meta_kubernetes_service_label_(.+)
- source_labels: [__meta_kubernetes_namespace]
action: replace
target_label: namespace
- source_labels: [__meta_kubernetes_service_name]
action: replace
target_label: service
# 已由ServiceMonitor监控
- source_labels: [__meta_kubernetes_service_name]
action: drop
regex: kube-dns
|
- 要想自动发现集群中的Service 就需要我们在Service的annotation区域添加
prometheus.io/scrape=true的声明 - 将上面的文件保存为prometheus-additional.yaml 然后通过这个文件创建一个对应的Secret对象
1
2
| $ kubectl create secret generic additional-configs --from-file=manifests/prometheus-additional.yaml
secret/additional-configs created
|
- 创建完成后 会将上面配置信息进行base64编码后作为prometheus-additional.yaml这个key对应的值存在
1
2
3
4
5
6
7
8
9
10
11
| $ kubectl get secrets additional-configs -o yaml
data:
prometheus-additional.yaml: LSBqb2JfbmFtZTogJ2t1YmVybmV0ZXMtc2VydmljZS1lbmRwb2ludHMnCiAga3ViZXJuZXRlc19zZF9jb25maWdzOgogIC0gcm9sZTogZW5kcG9pbnRzCiAgcmVsYWJlbF9jb25maWdzOgogIC0gc291cmNlX2xhYmVsczogW19fbWV0YV9rdWJlcm5ldGVzX3NlcnZpY2VfYW5ub3RhdGlvbl9wcm9tZXRoZXVzX2lvX3NjcmFwZV0KICAgIGFjdGlvbjoga2VlcAogICAgcmVnZXg6IHRydWUKICAtIHNvdXJjZV9sYWJlbHM6IFtfX21ldGFfa3ViZXJuZXRlc19zZXJ2aWNlX2Fubm90YXRpb25fcHJvbWV0aGV1c19pb19zY2hlbWVdCiAgICBhY3Rpb246IHJlcGxhY2UKICAgIHRhcmdldF9sYWJlbDogX19zY2hlbWVfXwogICAgcmVnZXg6IChodHRwcz8pCiAgLSBzb3VyY2VfbGFiZWxzOiBbX19tZXRhX2t1YmVybmV0ZXNfc2VydmljZV9hbm5vdGF0aW9uX3Byb21ldGhldXNfaW9fcGF0aF0KICAgIGFjdGlvbjogcmVwbGFjZQogICAgdGFyZ2V0X2xhYmVsOiBfX21ldHJpY3NfcGF0aF9fCiAgICByZWdleDogKC4rKQogIC0gc291cmNlX2xhYmVsczogW19fYWRkcmVzc19fLCBfX21ldGFfa3ViZXJuZXRlc19zZXJ2aWNlX2Fubm90YXRpb25fcHJvbWV0aGV1c19pb19wb3J0XQogICAgYWN0aW9uOiByZXBsYWNlCiAgICB0YXJnZXRfbGFiZWw6IF9fYWRkcmVzc19fCiAgICByZWdleDogKFteOl0rKSg/OjpcZCspPzsoXGQrKQogICAgcmVwbGFjZW1lbnQ6ICQxOiQyCiAgLSBhY3Rpb246IGxhYmVsbWFwCiAgICByZWdleDogX19tZXRhX2t1YmVybmV0ZXNfc2VydmljZV9sYWJlbF8oLispCiAgLSBzb3VyY2VfbGFiZWxzOiBbX19tZXRhX2t1YmVybmV0ZXNfbmFtZXNwYWNlXQogICAgYWN0aW9uOiByZXBsYWNlCiAgICB0YXJnZXRfbGFiZWw6IGt1YmVybmV0ZXNfbmFtZXNwYWNlCiAgLSBzb3VyY2VfbGFiZWxzOiBbX19tZXRhX2t1YmVybmV0ZXNfc2VydmljZV9uYW1lXQogICAgYWN0aW9uOiByZXBsYWNlCiAgICB0YXJnZXRfbGFiZWw6IGt1YmVybmV0ZXNfbmFtZQo=
kind: Secret
metadata:
creationTimestamp: "2025-06-18T07:50:33Z"
name: additional-configs
namespace: monitoring
resourceVersion: "26440898"
uid: 97ae179c-6516-4050-9b0a-c95596cf387e
type: Opaque
|
- 然后我们只需要在声明prometheus的资源对象文件中添加这个额外的配置即可
 1
 2
 3
 4
 5
 6
 7
 8
 9
10
11
12
13
14
15
16
17
18
19
20
21
22
23
24
25
26
27
28
29
30
31
32
33
34
35
36
37
38
39
40
41
42
43
44
45
46
47
48
49
50
51
52
53
| apiVersion: monitoring.coreos.com/v1
kind: Prometheus
metadata:
labels:
app.kubernetes.io/component: prometheus
app.kubernetes.io/instance: k8s
app.kubernetes.io/name: prometheus
app.kubernetes.io/part-of: kube-prometheus
app.kubernetes.io/version: 2.54.1
name: k8s
namespace: monitoring
spec:
alerting:
alertmanagers:
- apiVersion: v2
name: alertmanager-main
namespace: monitoring
port: web
enableFeatures: []
externalLabels: {}
image: quay.io/prometheus/prometheus:v2.54.1
nodeSelector:
kubernetes.io/os: linux
podMetadata:
labels:
app.kubernetes.io/component: prometheus
app.kubernetes.io/instance: k8s
app.kubernetes.io/name: prometheus
app.kubernetes.io/part-of: kube-prometheus
app.kubernetes.io/version: 2.54.1
podMonitorNamespaceSelector: {}
podMonitorSelector: {}
probeNamespaceSelector: {}
probeSelector: {}
replicas: 2
resources:
requests:
memory: 400Mi
ruleNamespaceSelector: {}
ruleSelector: {}
scrapeConfigNamespaceSelector: {}
scrapeConfigSelector: {}
securityContext:
fsGroup: 2000
runAsNonRoot: true
runAsUser: 1000
serviceAccountName: prometheus-k8s
serviceMonitorNamespaceSelector: {}
serviceMonitorSelector: {}
version: 2.54.1
additionalScrapeConfigs:
name: additional-configs
key: prometheus-additional.yaml
|
- 在Prometheus UI的配置页面 已经看到有对应的配置信息 但是targets页面下却没有对应的监控任务 查看Prometheus的Pod日志
1
2
| ts=2025-06-18T08:03:27.801Z caller=klog.go:116 level=error component=k8s_client_runtime func=ErrorDepth msg="pkg/mod/k8s.io/client-go@v0.29.3/tools/cache/reflector.go:229: Failed to watch *v1.Service: failed to list *v1.Service: services is forbidden: User \"system:serviceaccount:monitoring:prometheus-k8s\" cannot list resource \"services\" in API group \"\" at the cluster scope"
...
|
- 可以看到有很多错误日志出现 都是
xxx is forbidden 这说明是RBAC权限的问题 通过Prometheus资源对象的陪着你可以值得 Promtheus绑定了一个名为prometheus-k8s的ServiceAccount对象 而这个对象绑定的是一个名为promtheus-k8s的ClusterRole - 查看ClusterRole的内容 我们可以看到明显没有对Service或者Pod的list权限 我们添加上对象的权限即可
1
2
3
4
5
6
7
8
9
10
11
12
13
14
15
16
17
18
19
20
21
22
23
24
25
| apiVersion: rbac.authorization.k8s.io/v1
kind: ClusterRole
metadata:
creationTimestamp: "2025-06-13T12:48:39Z"
labels:
app.kubernetes.io/component: prometheus
app.kubernetes.io/instance: k8s
app.kubernetes.io/name: prometheus
app.kubernetes.io/part-of: kube-prometheus
app.kubernetes.io/version: 2.54.1
name: prometheus-k8s
resourceVersion: "25082977"
uid: 4cc3523b-1a2d-4682-bd6e-f23a11e661e7
rules:
- apiGroups:
- ""
resources:
- nodes/metrics
verbs:
- get
- nonResourceURLs:
- /metrics
- /metrics/slis
verbs:
- get
|
- 更新
prometheus-k8s ClusterRole权限
 1
 2
 3
 4
 5
 6
 7
 8
 9
10
11
12
13
14
15
16
17
18
19
20
21
22
23
| - apiGroups:
- ""
resources:
- nodes
- services
- endpoints
- pods
- nodes/proxy
verbs:
- get
- list
- watch
- apiGroups:
- ""
resources:
- configmaps
- nodes/metrics
verbs:
- get
- nonResourceURLs:
- /metrics
verbs:
- get
|
数据持久化
- 目前的Promtheus 如裹我们重启Pod 则会丢失之前采集的数据 这是因为promeehteus这个CRD创建的Prometheus并没有做数据的持久化
- 直接查看生成的Prometheus Pod的挂载详情 我们发现Prometheus的数据目录/promtheus实际上是通过
emptyDir进行挂载的 - 我们知道
emptyDir挂载的数据的声明周期和Pod生命周期是一致的 如果Pod挂掉 数据也跟着丢失 - 线上的监控数据我们肯定需要做持久化 prometheus CRD资源也为我们提供了数据持久化的配置方法 由于我们的Prometheus最终是通过Statefulset控制器进行部署的 所以我们这里需要通过
storageclass来做数据持久化
1
2
3
4
5
6
7
8
9
| $ kubectl get pod prometheus-k8s-0 -o yaml
......
volumeMounts:
- mountPath: /prometheus
name: prometheus-k8s-db
......
volumes:
- emptyDir: {}
name: prometheus-k8s-db
|
- 这里使用我本地的nfs stroageclass 在prometheus CRD资源对象中添加如下配置
1
2
3
4
5
6
7
| storage:
volumeClaimTemplate:
spec:
storageClassName: nfs-client
resources:
requests:
storage: 10Gi
|
- 更新服务之后 我们查看对应的pv/pvc/promtehus 可以看到已经进行了持久化
 1
 2
 3
 4
 5
 6
 7
 8
 9
10
11
12
13
14
15
16
17
18
19
20
21
| # POD
volumes:
- name: prometheus-k8s-db
persistentVolumeClaim:
claimName: prometheus-k8s-db-prometheus-k8s-1
volumeMounts:
- mountPath: /prometheus
name: prometheus-k8s-db
subPath: prometheus-db
# pv / pvc
$ kubectl get pv
NAME CAPACITY ACCESS MODES RECLAIM POLICY STATUS CLAIM STORAGECLASS VOLUMEATTRIBUTESCLASS REASON AGE
pvc-c2cd37f7-9299-4c47-97a7-b841e4c28e9b 10Gi RWO Delete Bound monitoring/prometheus-k8s-db-prometheus-k8s-1 nfs-client <unset> 10m
pvc-c6177fc6-74d5-4e1f-9213-86f90757b3d2 10Gi RWO Delete Bound monitoring/prometheus-k8s-db-prometheus-k8s-0 nfs-client <unset> 10m
$ kubectl get pvc
NAME STATUS VOLUME CAPACITY ACCESS MODES STORAGECLASS VOLUMEATTRIBUTESCLASS AGE
prometheus-k8s-db-prometheus-k8s-0 Bound pvc-c6177fc6-74d5-4e1f-9213-86f90757b3d2 10Gi RWO nfs-client <unset> 10m
prometheus-k8s-db-prometheus-k8s-1 Bound pvc-c2cd37f7-9299-4c47-97a7-b841e4c28e9b 10Gi RWO nfs-client <unset> 10m
|
副本与分片
1
2
3
4
5
6
| # 启动的Pod数量为 replicas * shards
replicas: 1
shards: 2
resources:
requests:
memory: 400Mi
|
Reference
apt install speciffic version
set-proxy-on-ubuntu-docker
apt-get-like-yum-whatprovides
kubectl-get-commponentstatus-shows-unhealthy